Last updated at Wed, 16 Aug 2017 00:31:20 GMT
Nexpose supports a variety of complementary reporting solutions that allows you to access, aggregate, and take action upon your scan data. However, knowing which solution is best for the circumstance can sometimes be confusing, so let's review what's available to help you pick the right tool for the job.
I want to pull a vulnerability assessment report out of Nexpose. What are my options?
Web Interface
The Nexpose web interface provides a quick and easy way to navigate through your data. You can drill-down and navigate through cross references and tables support exporting to CSV. Dashboards are a more flexible and configurable way to organize and visualize the data and printable reports support more comprehensive aggregation. The web interface is best suited for ad-hoc exploratory analysis of data.
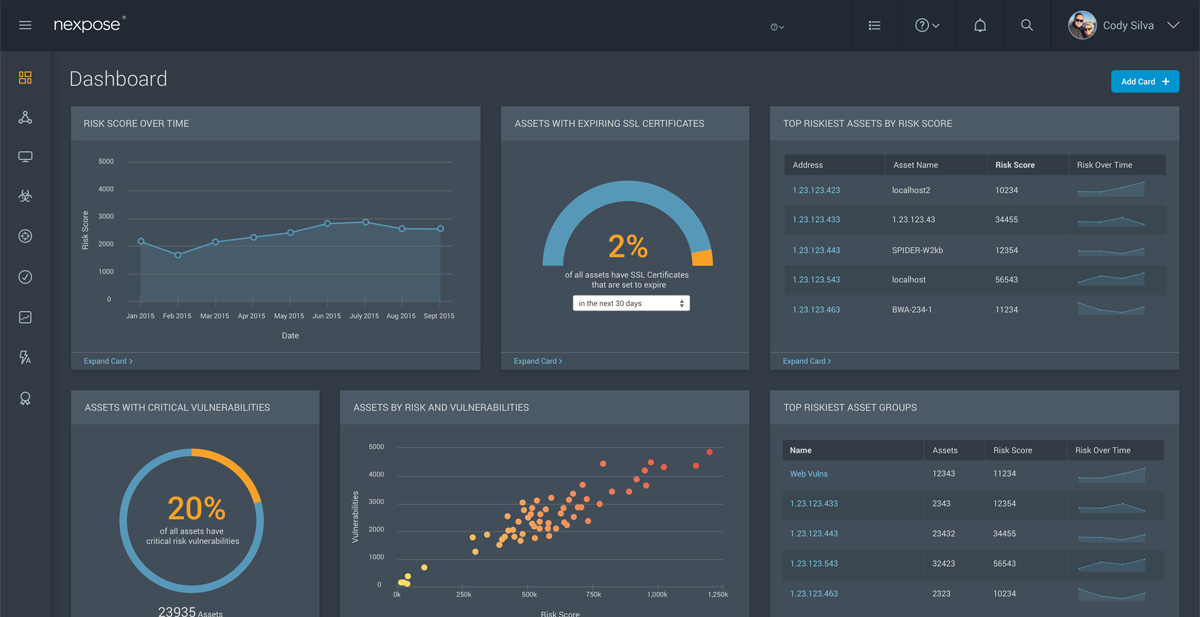
Dashboards
Dashboards provide a rich way to visualize and analyze your data in real time. Dashboards in Nexpose Now are highly configurable, flexible, and adaptable to your reporting needs. Cards in the dashboard are easy to use and can be exported to CSV, but are not printable or distributable outside of a web interface natively. Built-in and/or custom report templates are a better option for scheduled distribution and printing.
Built-in Report Templates
Built-in vulnerability assessment report templates allow configurable reporting for common use cases, such as prioritizing remediation, providing overview of remediation progress, auditing results, etc. Each template allows simple user-interface configuration of the scope of the report, as well as scheduling, distribution and other settings that can make automated workflows simple to execute. Built-in report templates are the first feature you should use to get familiar with Nexpose reporting capabilities, format, etc. Built-in report templates may also be configured and generated through the external XML-based application programming interface (API) for even more control. If you are satisfied with the level of control and configuration, but would like alternate printable templates, consider using custom report templates.
Custom Report Templates
Custom report templates extend the built-in report templates with various additional reports. Several are available here on the community but you may also engage with the Rapid7 professional services team to customize the building and deployment of a report specifically suited to your needs. This option is ideal when your organization has little SQL expertise or other reporting infrastructure in place.
SQL Query Export
SQL Query Export provides fine-grained control over the data output in a CSV-formatted reporting. Raw SQL queries against the Reporting Data Model allow any combination, slicing, and intersection of data that is required. This lightweight option is best when the scale of the report is limited, and the CSV format is ideal for consumption. SQL Query Export works well with adhoc API reporting and other scripting-oriented solutions. For large scale deployments that want to have efficient, indexed access to raw data, consider using Data Warehouse Export instead.
Data Warehouse Export
The Data Warehouse Export feature allows Nexpose to perform an extract transform and load (ETL) process to an external data warehouse. The export supports a highly-optimized, indexed, and efficient dimensional model that any business intelligence (BI) tool can easily connect to. If you are familiar with a BI tool or your organization already has access to one, then warehousing may be a good fit. The data warehouse export runs on regularly scheduled intervals and as such will have some latency before data is available in the warehouse. The data warehouse is best suited for large scale enterprise deployments where hundreds of reports may generate on a daily basis. The more active your organization is at reporting, the more benefit you get from the warehouse. However, the data warehouse does require a separately managed and installed PostgreSQL instance to export into and does not provide the built-in capabilities such as role-based access control, distribution, or scheduling natively. BI tools can be used to provide these report management capabilities, such as Tableau, Qlik, Pentaho, Domo, JasperReports Server and many others.
How do I know which reporting solution is right for me?
The following chart highlights some key similarities and differences between the various reporting solutions, which you can use to help select the reporting capabilities best for you and your organization.
| Web Interface | Dashboards | Built-in Reports | Custom Reports | SQL Query Export | Data Warehouse Export | |
|---|---|---|---|---|---|---|
| Output Format | CSV | CSV | CSV, HTML, PDF, RTF, XML | PDF, HTML, RTF | CSV | SQL |
| Distribution (e.g. SMTP) | ✔ | ✔ | ✔ | |||
| Scheduling | ✔ | ✔ | ✔ | |||
| Access Control | ✔ | ✔ | ✔ | ✔ | ✔ | |
| Printable Output Format | ✔ | ✔ | ||||
| Customizable Output | ✔ | ✔ | ✔ | ✔ | ||
| API | ✔ | ✔ | ✔ | |||
| Localizable | ✔ | ✔ | ℹ | ℹ | ||
| Enterprise Scalability | ✔ | ℹ | ✔ | |||
| Raw Data Access | ℹ | ✔ | ||||
| JDBC/ODBC Access | ✔ |
✔ Full support
ℹ Partial support (varies)