What is a threat?
When there is an adversary with the intent,
capability, and opportunity, a threat exists.
When two or more of these elements are
present (e.g., intent and capability, but no
opportunity), we call it an impending threat,
because there is just one missing piece before
it becomes a true threat.
When there is just one element present
(e.g., an opportunity in the form of a software
vulnerability), we call it a potential threat. There
is the potential for it to turn into a true threat,
although there are additional components that
need to come to fruition before it has a real
impact to most organizations.
Introduction
At Rapid7, we’re obsessed with giving our customers, prospects, and the industry as a whole the knowledge, tools, and telemetry to achieve positive outcomes within their security programs. As the entire company goes on this mindset evolution from building software to building solutions that have defined and achievable outcomes, we are doing the same with this Threat Report. So what has changed?
- The narrative: We have changed the narrative to fully embrace the “so what.” Each section provides one (or more) visuals with analysis that clearly answers three fundamental questions: “What does this mean for you,” “How can you use it,” and “How can it improve your security program.”
- The data: We have continued to improve our data collection and classification to simplify your understanding of the underlying data.
- Our reach: This report, we’ve partnered with our User Experience (UX) team to analyze a mountain of data on security programs from a recent exercise conducted, seeking to identify business-relevant outcomes for Vulnerability Management (VM) and Detection & Response (D&R) programs.
- The report structure: As we add more content, we’ve found we needed more structure. As such, we’ve defined 4 sections for this report: “Focus on Threat Telemetry,” “Focus on Detections,” “Focus on Recommendations,” “Focus on Security Programs.”
As you read through the report, know that we're citing both Quarter 4 (Q4) of 2019 data, as well as a review of 2019 full-year data. Our goal is to provide the quarterly snapshot as we always do, while also offering a comparison against data for the entire year and what it means heading into 2020.
Our threat telemetry data analysis reveals that organizations continue to host vulnerable, internet-exposed systems that are being targeted by attackers. Our recommendation is to prioritize measuring and improving the time to deploy patches, especially to internet-facing systems. We also recommend measuring and improving how external attackers see your organization with respect to what systems and services are available to the internet.
Our threat telemetry and detections data analysis reveals that attackers are targeting valid user accounts as their preferred method for breaching an environment. Our recommendation is to focus on improving user account security with two-factor authentication, password complexity requirements, password rotation policy, single sign-on solutions for external business accounts, and monitoring the dark web for leaked credentials. We also recommend that organizations increase their ability to detect the unauthorized use of credentials through User Behavior Analytics (UBA).
Our Managed Detection and Response (MDR) team identifies and stops 85% of threats within one hour of initiation and over 90% within a day; so can you.
Our recommendation is to invest in developing threat detection capabilities that implement many different techniques to catch attackers. By investing in people and technology, you will gain the expertise to drive the development of the scientific methodologies while giving your threat analysts the visibility they need to accomplish their outcomes.
The MITRE ATT&CK™ Framework helps you make investment decisions for your security program and understand how your investments are performing. The framework offers seven easy-to-understand tactics that attackers use and several hundred techniques that your security teams can focus on for detection. By classifying the data, your security team can give you insight into the trends of the threats targeting you. See red? Invest! See green? Your investment is performing well.
We know what organizations are doing to remediate breaches and how they are working to proactively mitigate risk and impact. We recommend you read the “Focus on Recommendations” section.
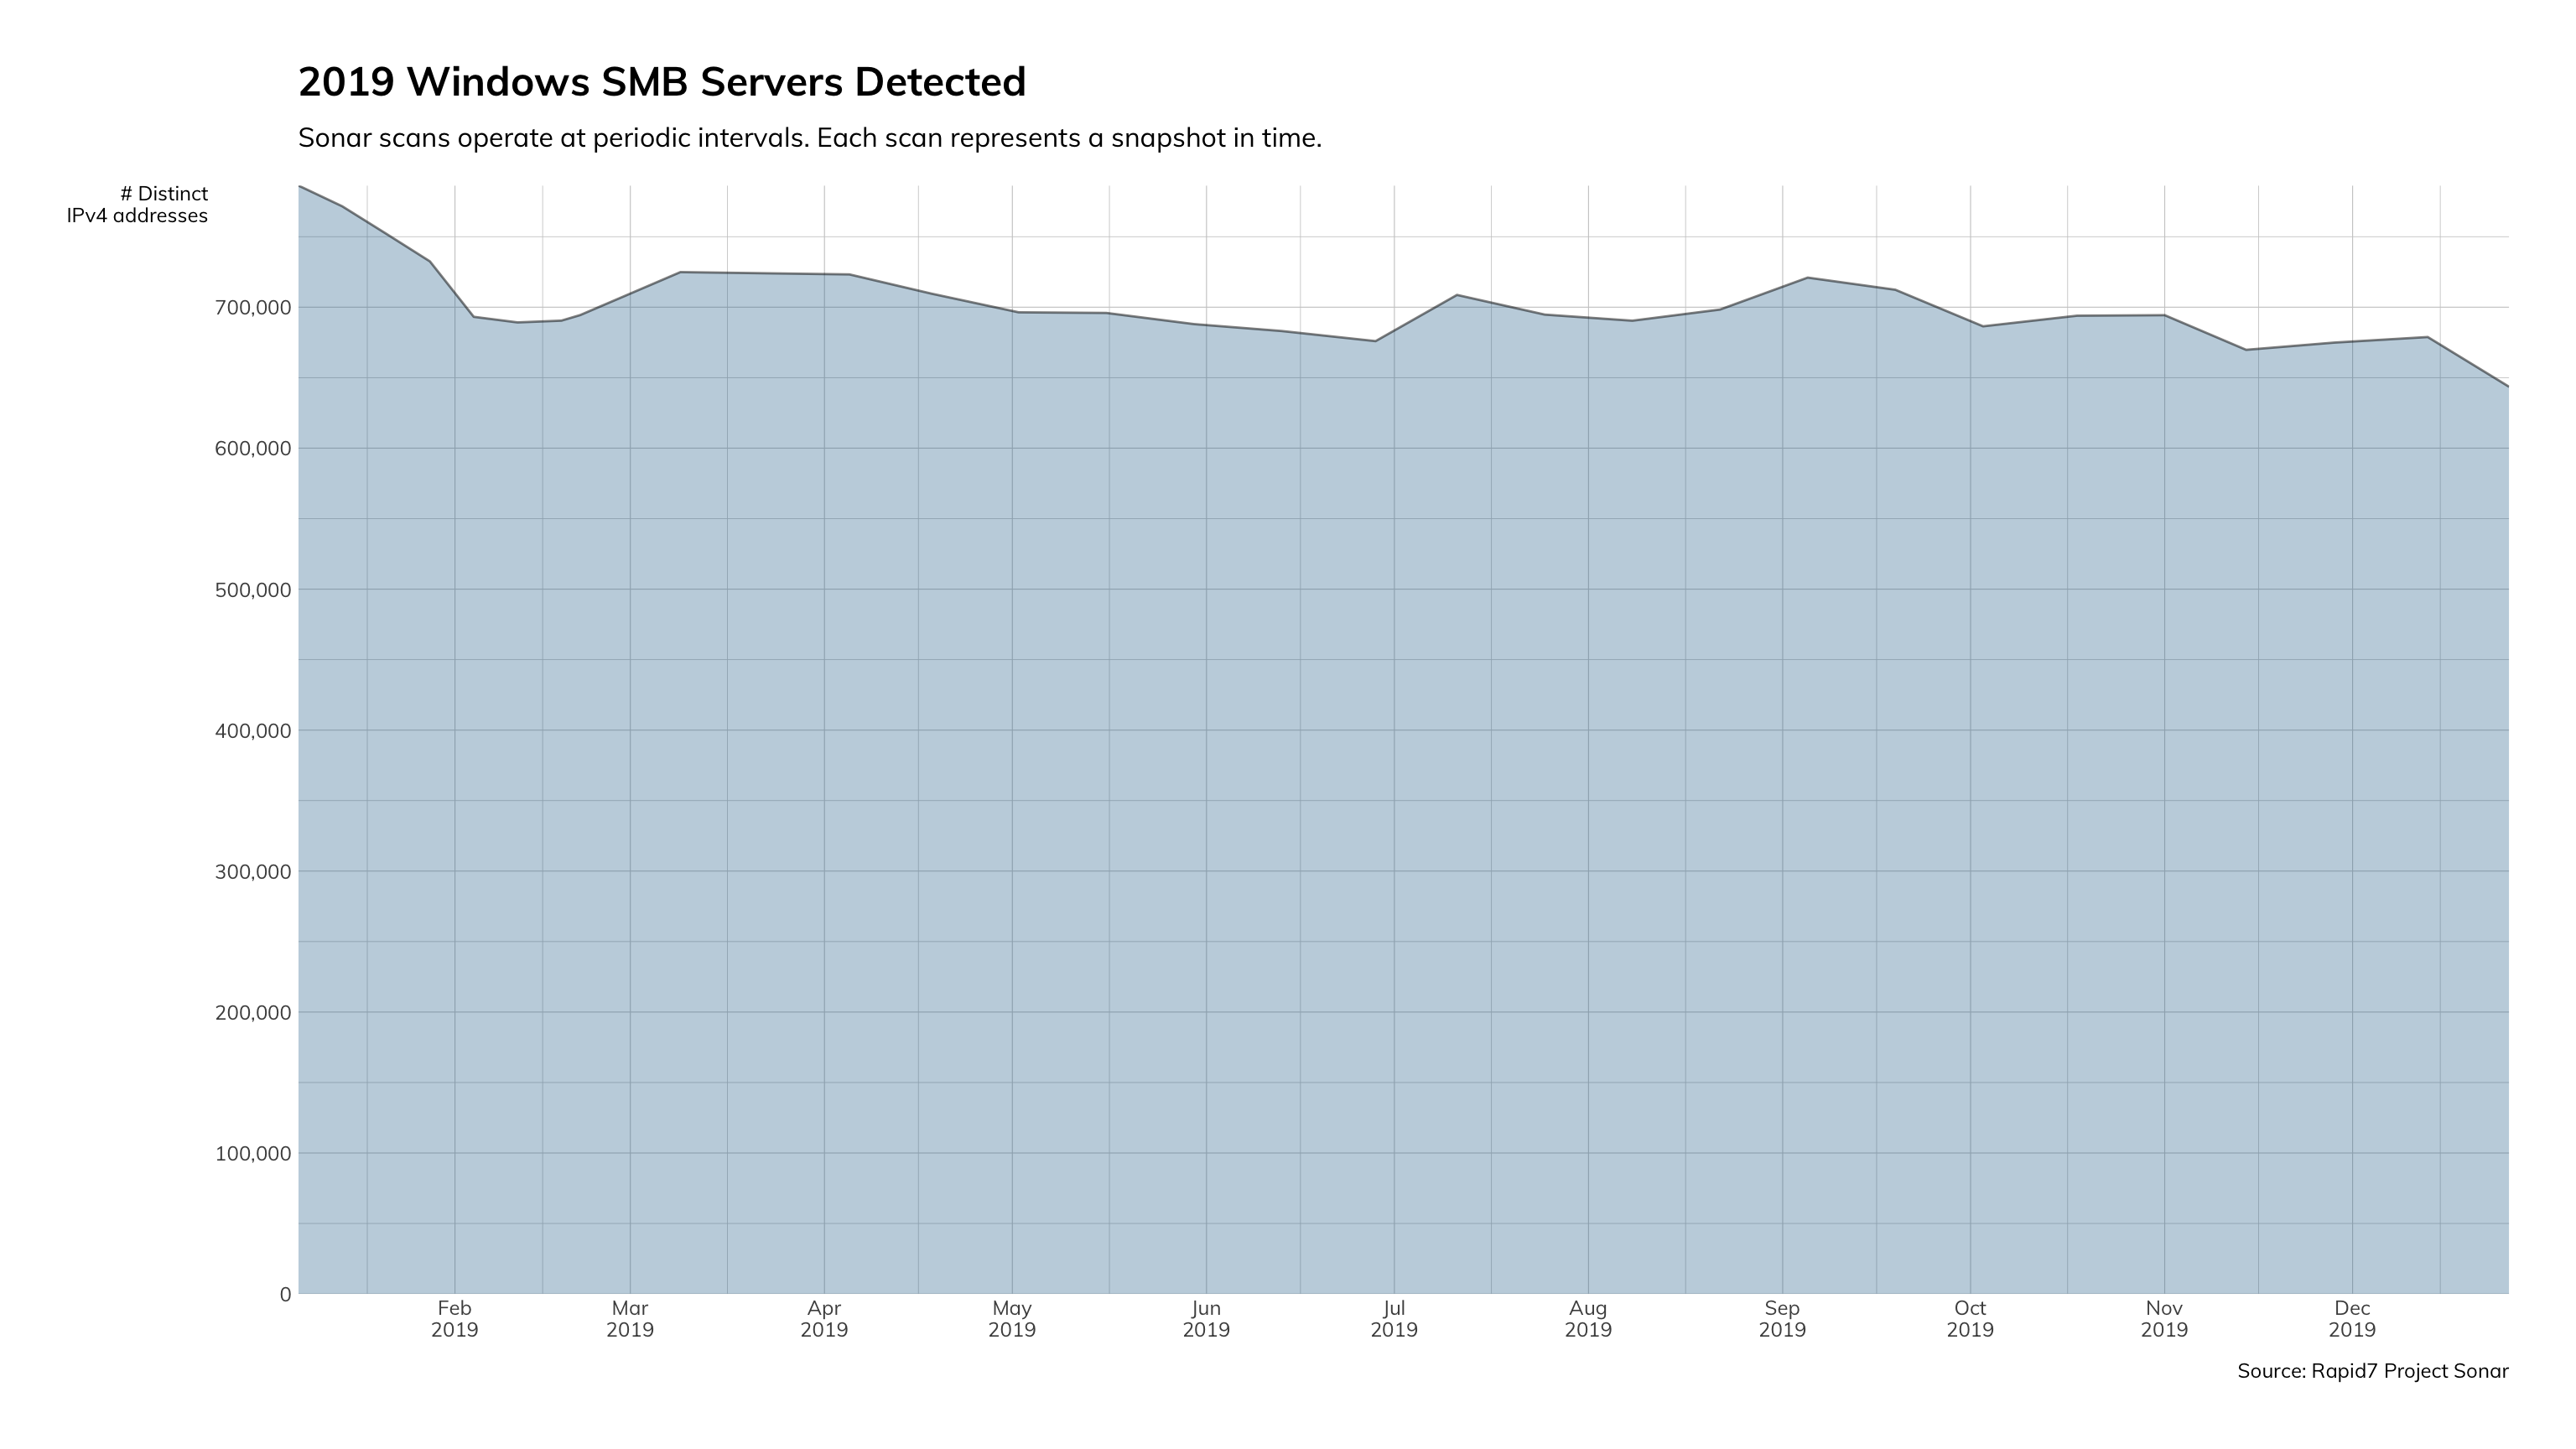
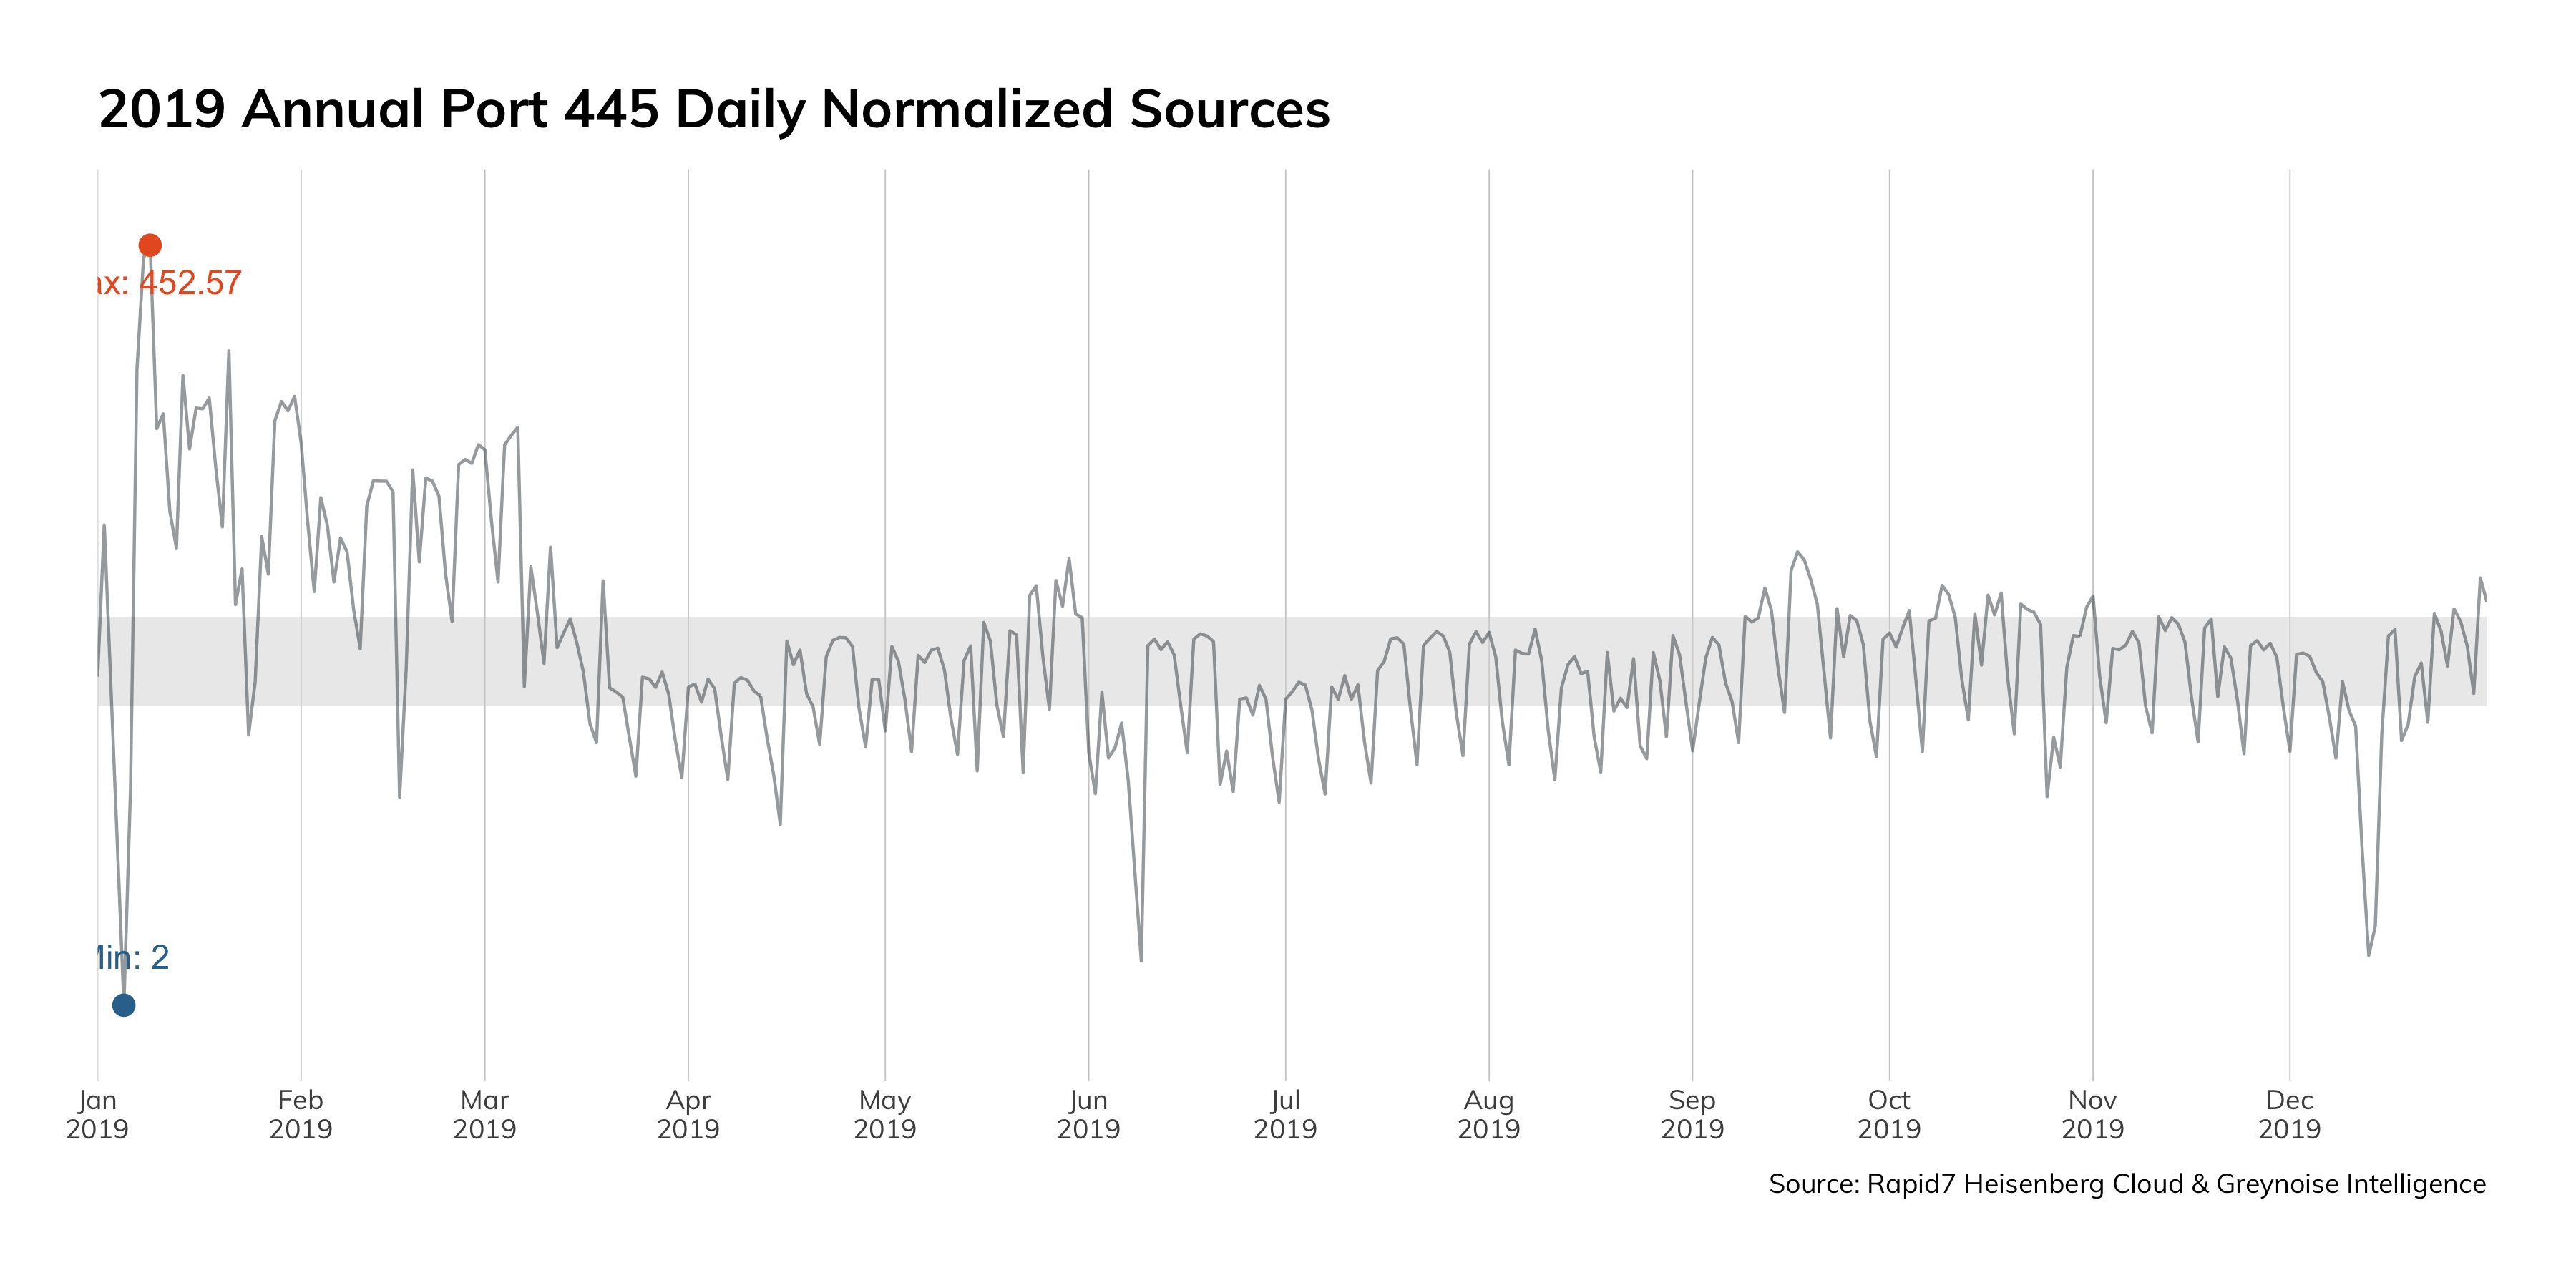
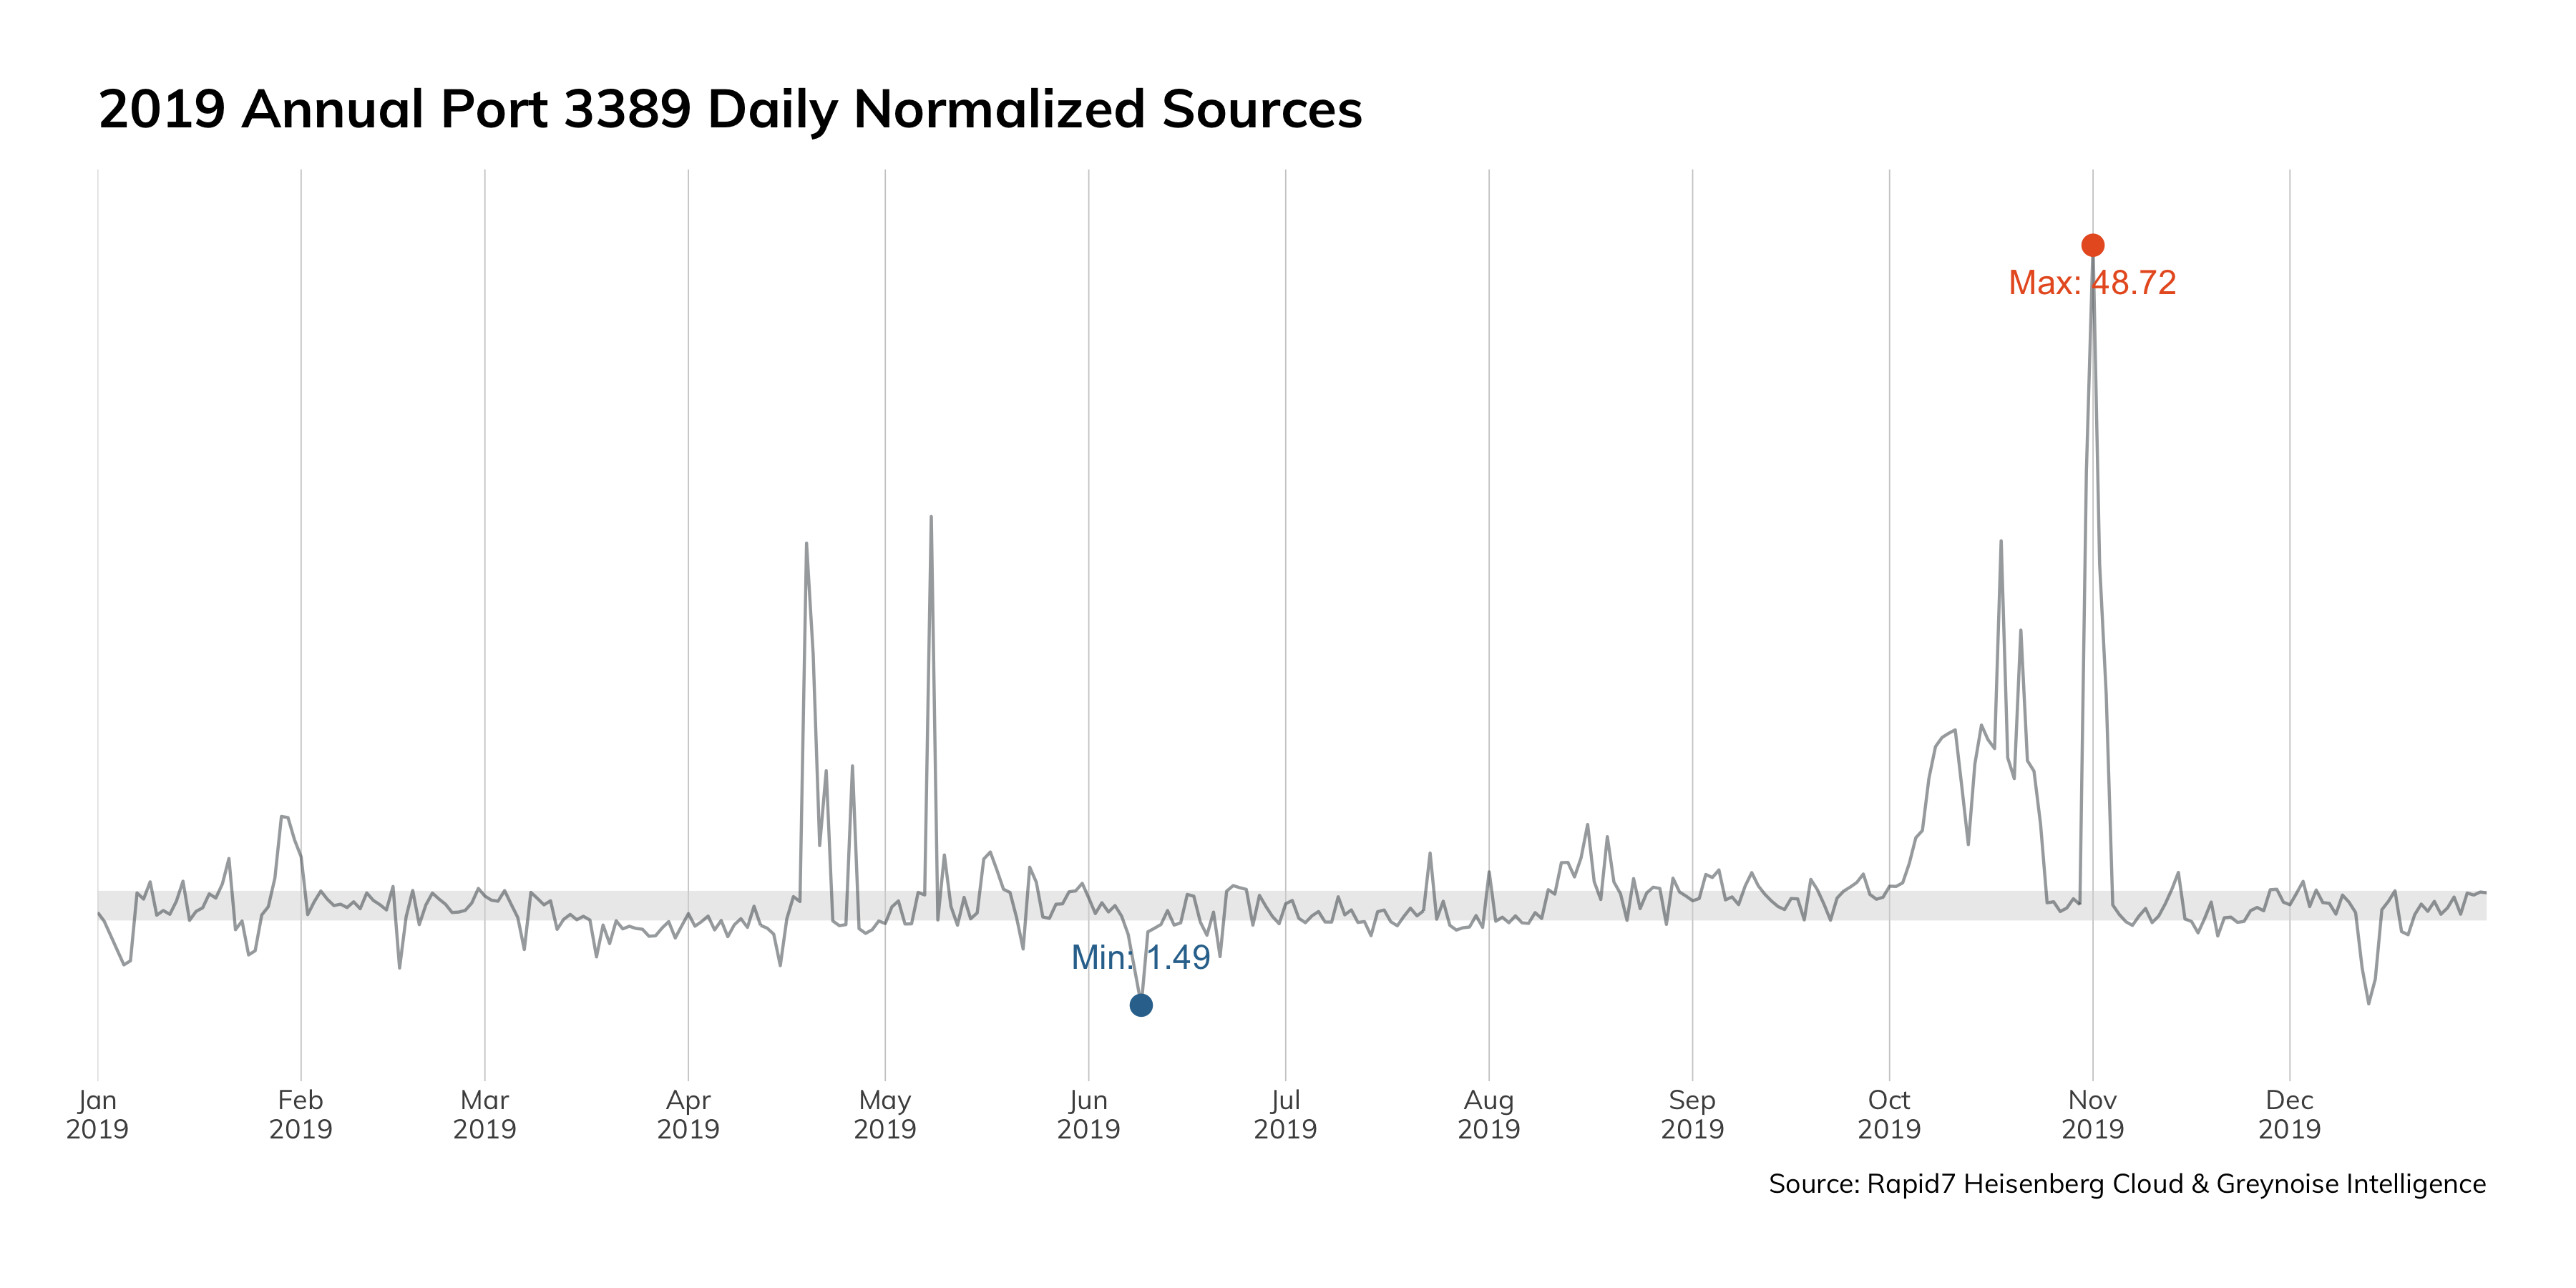
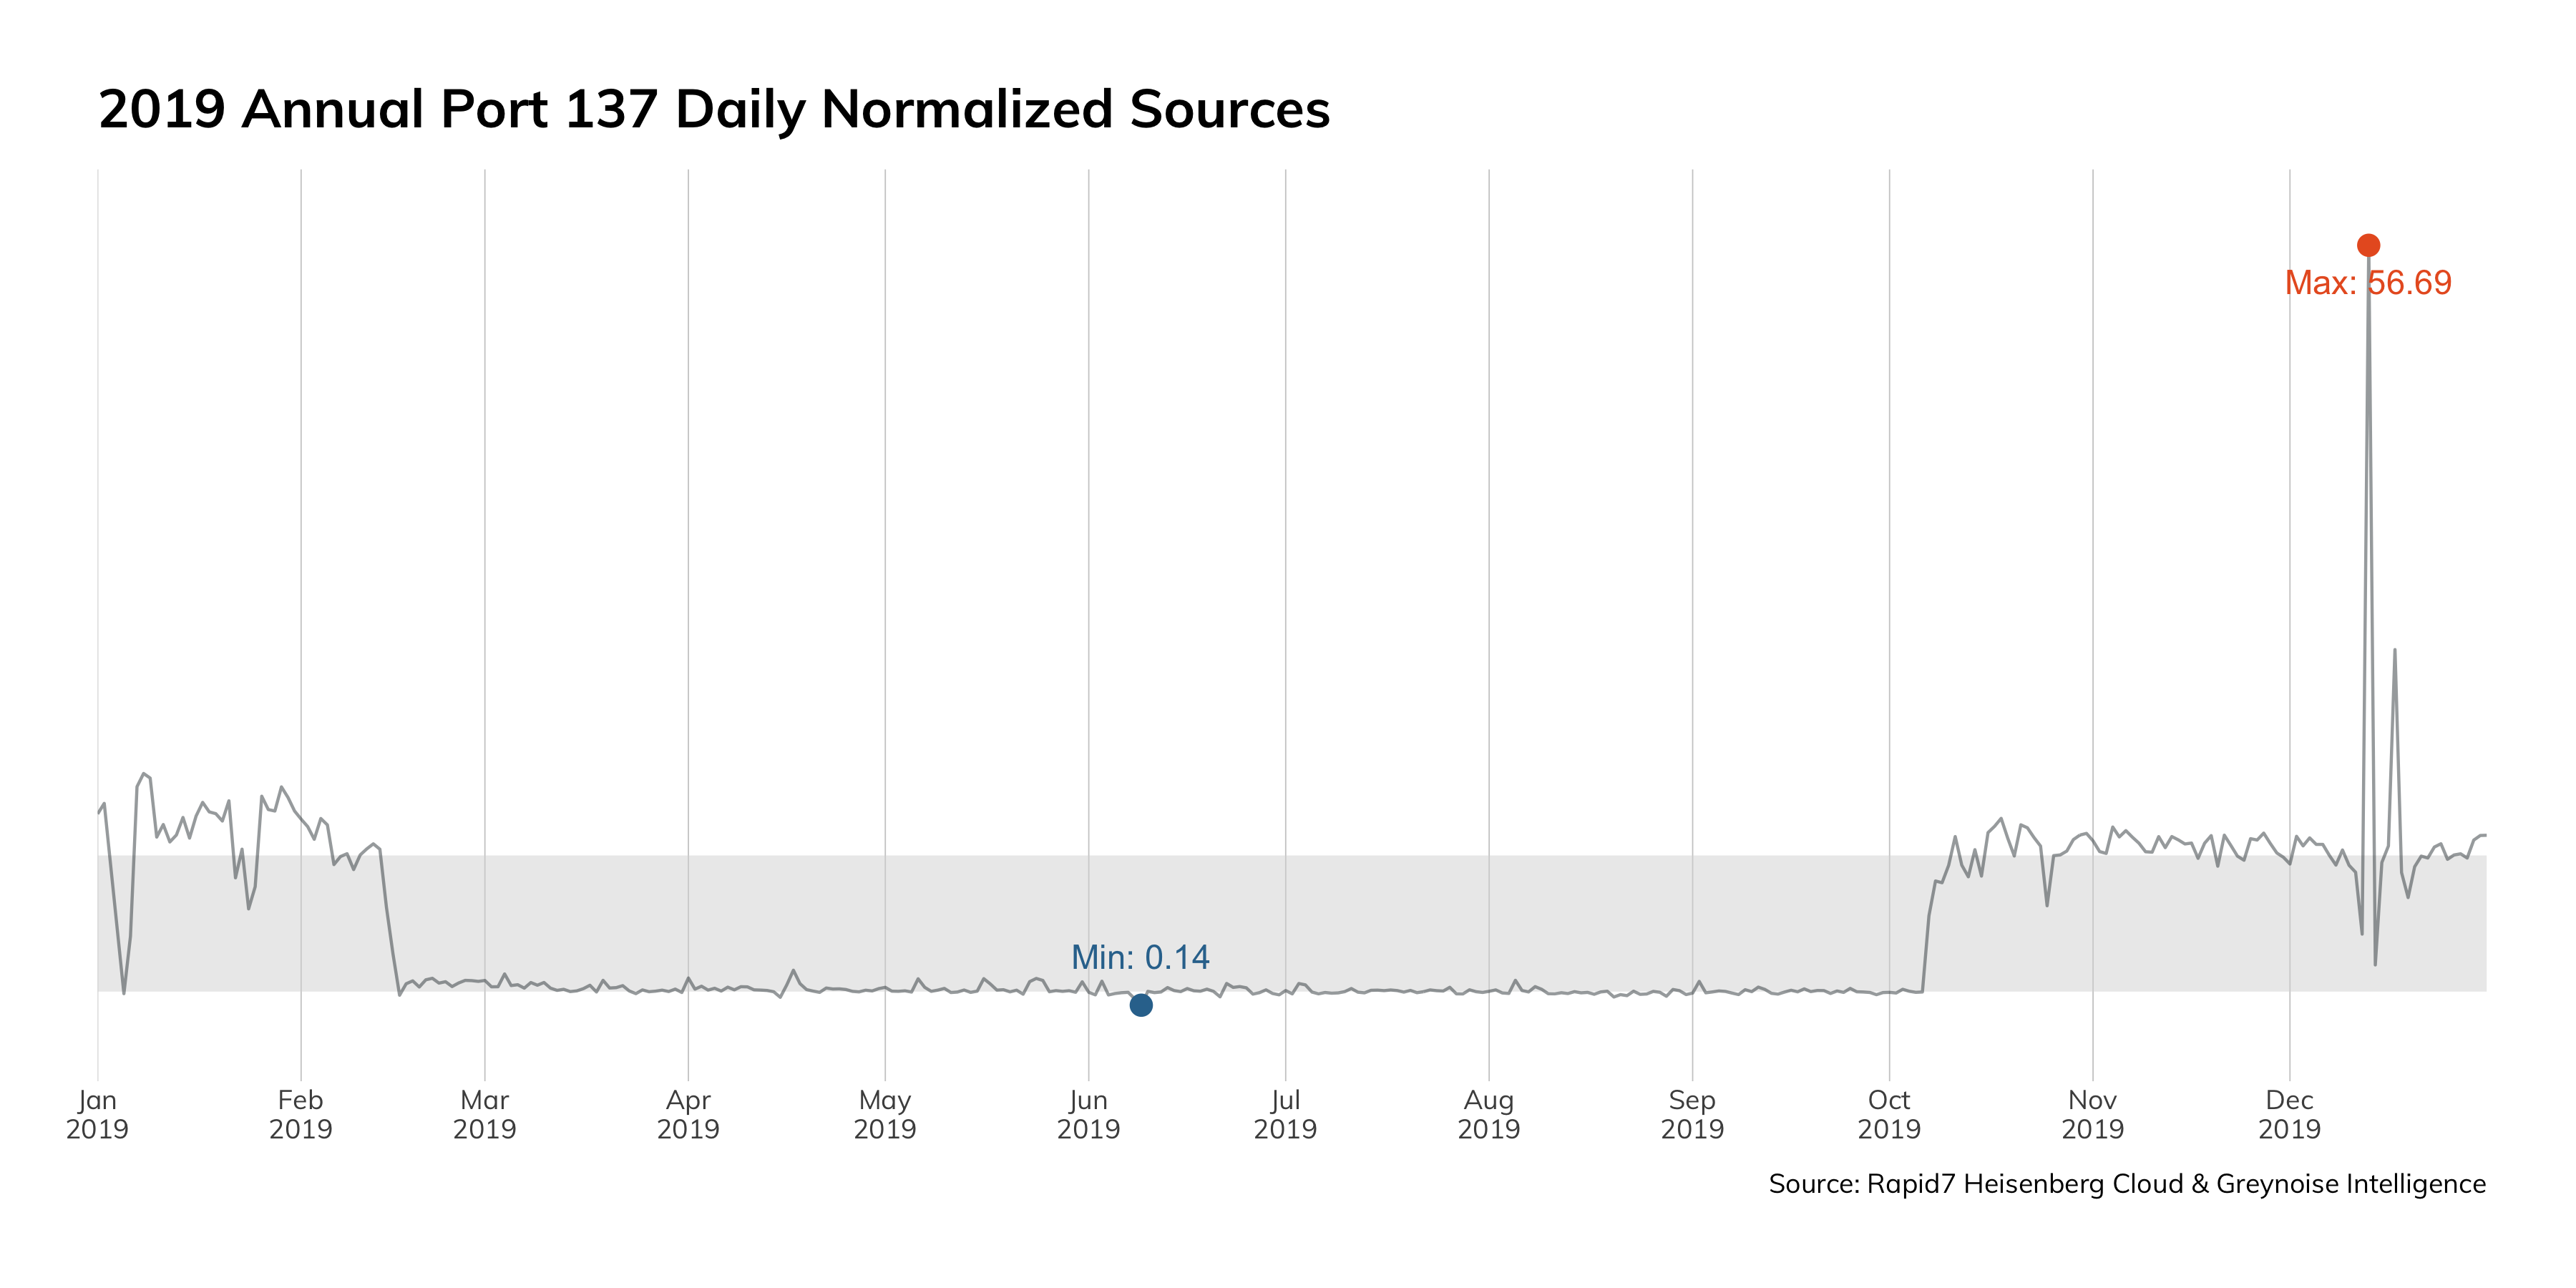
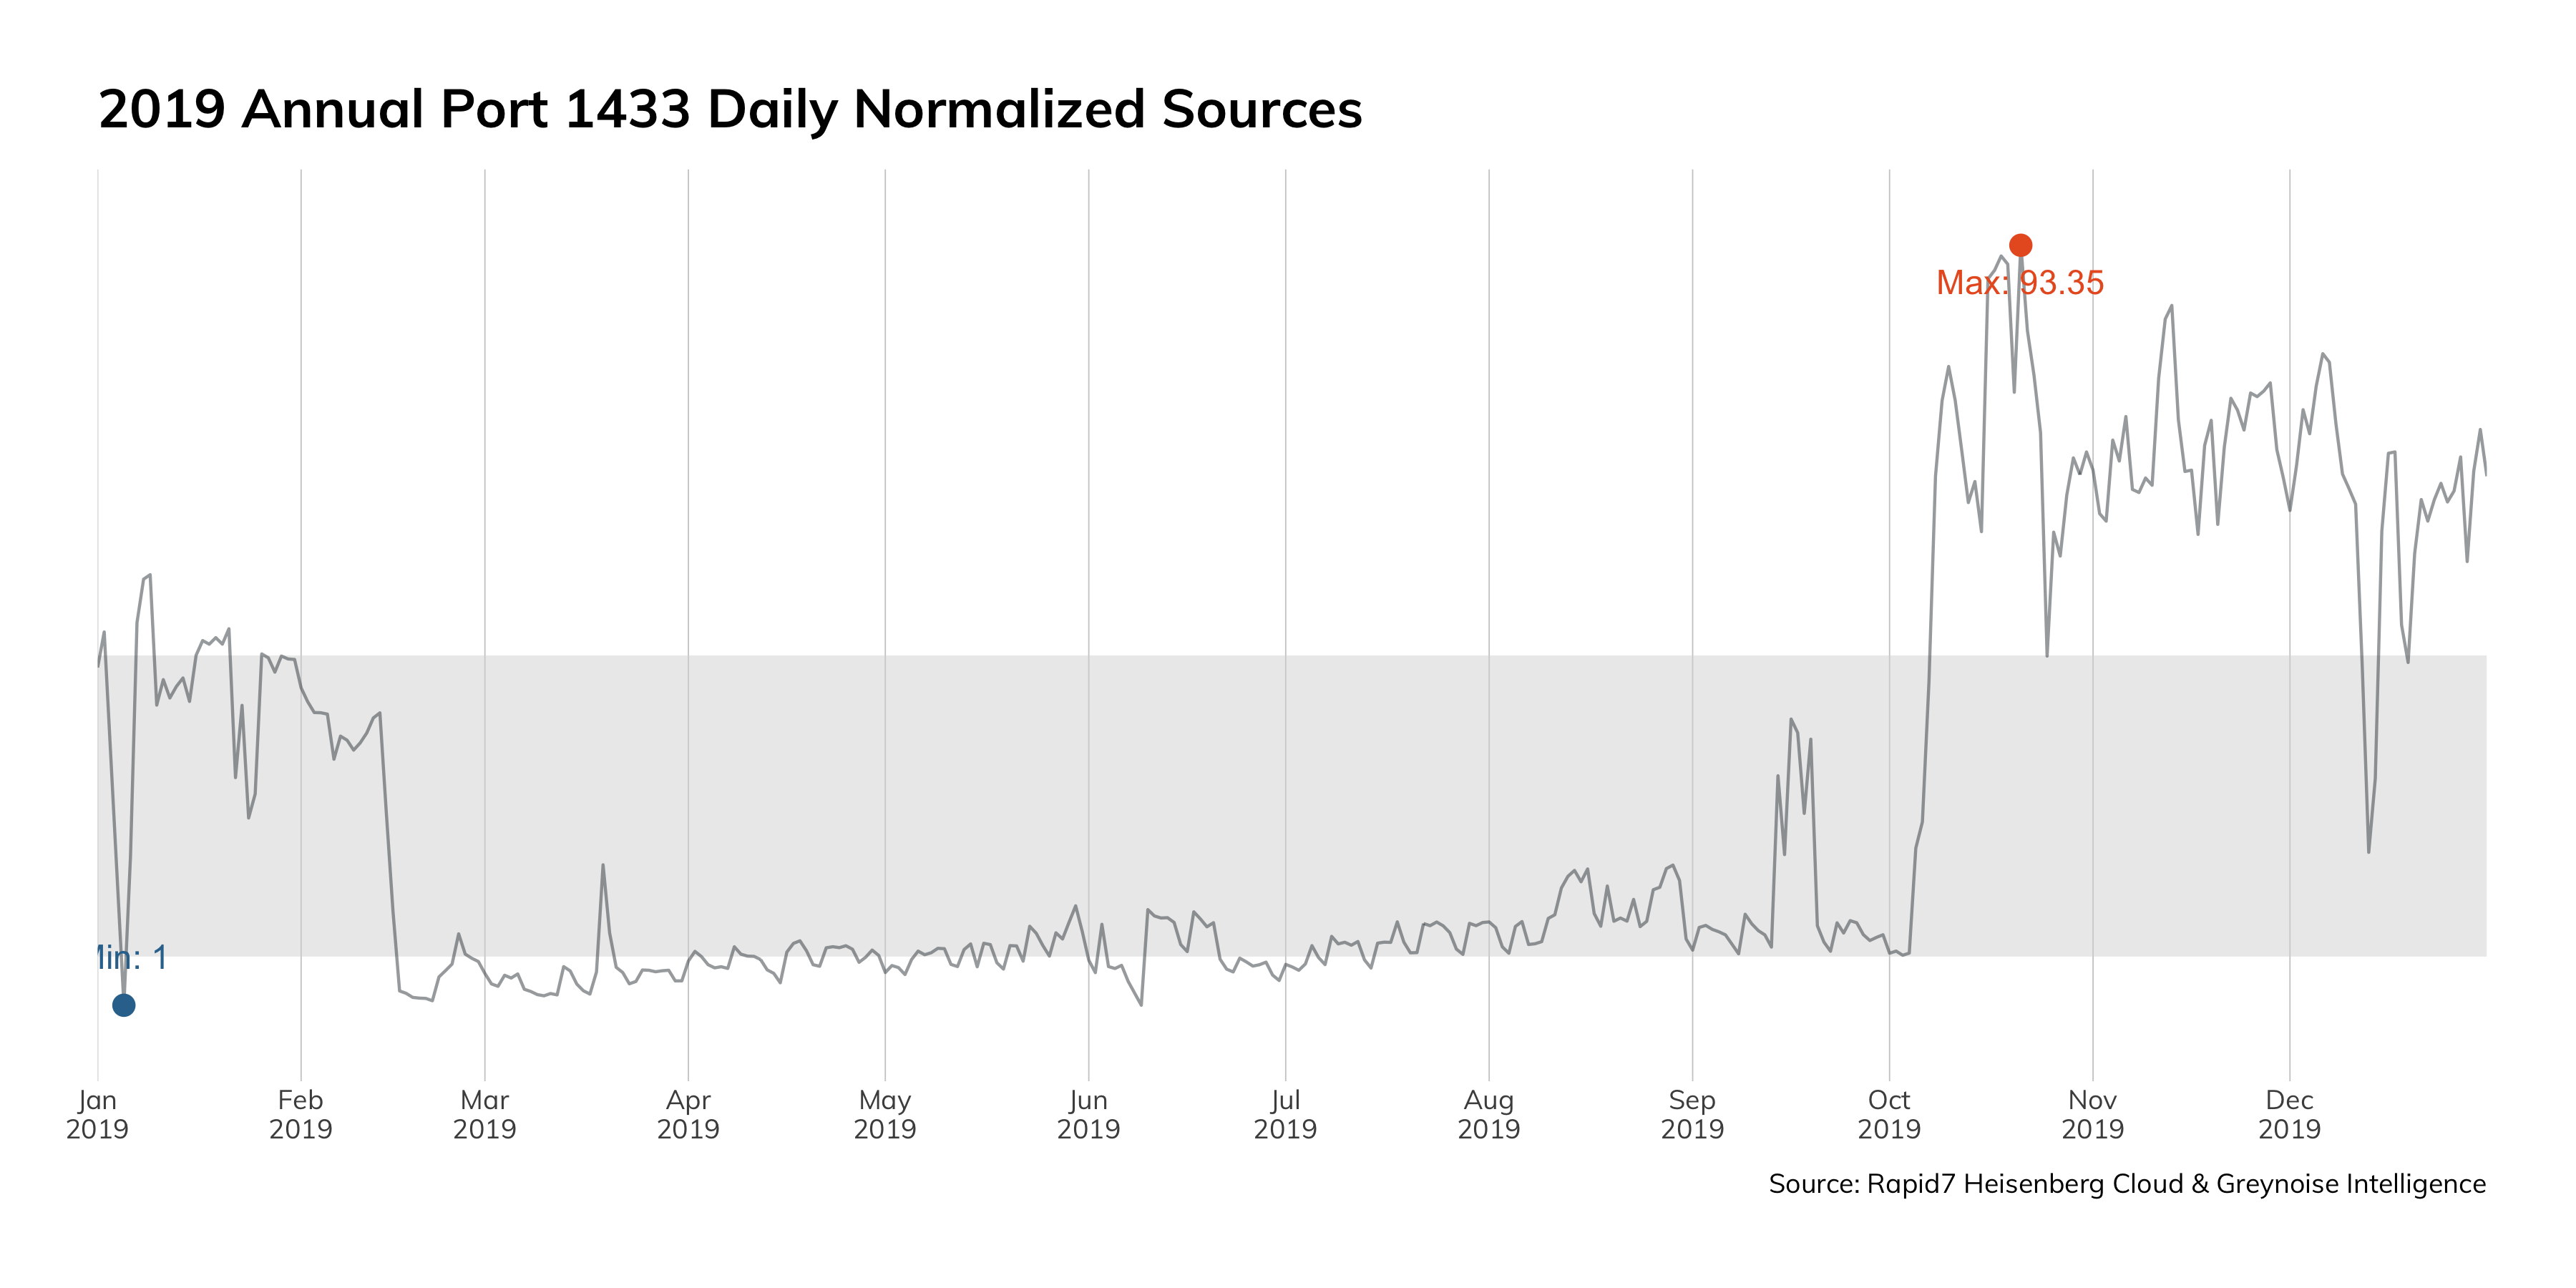
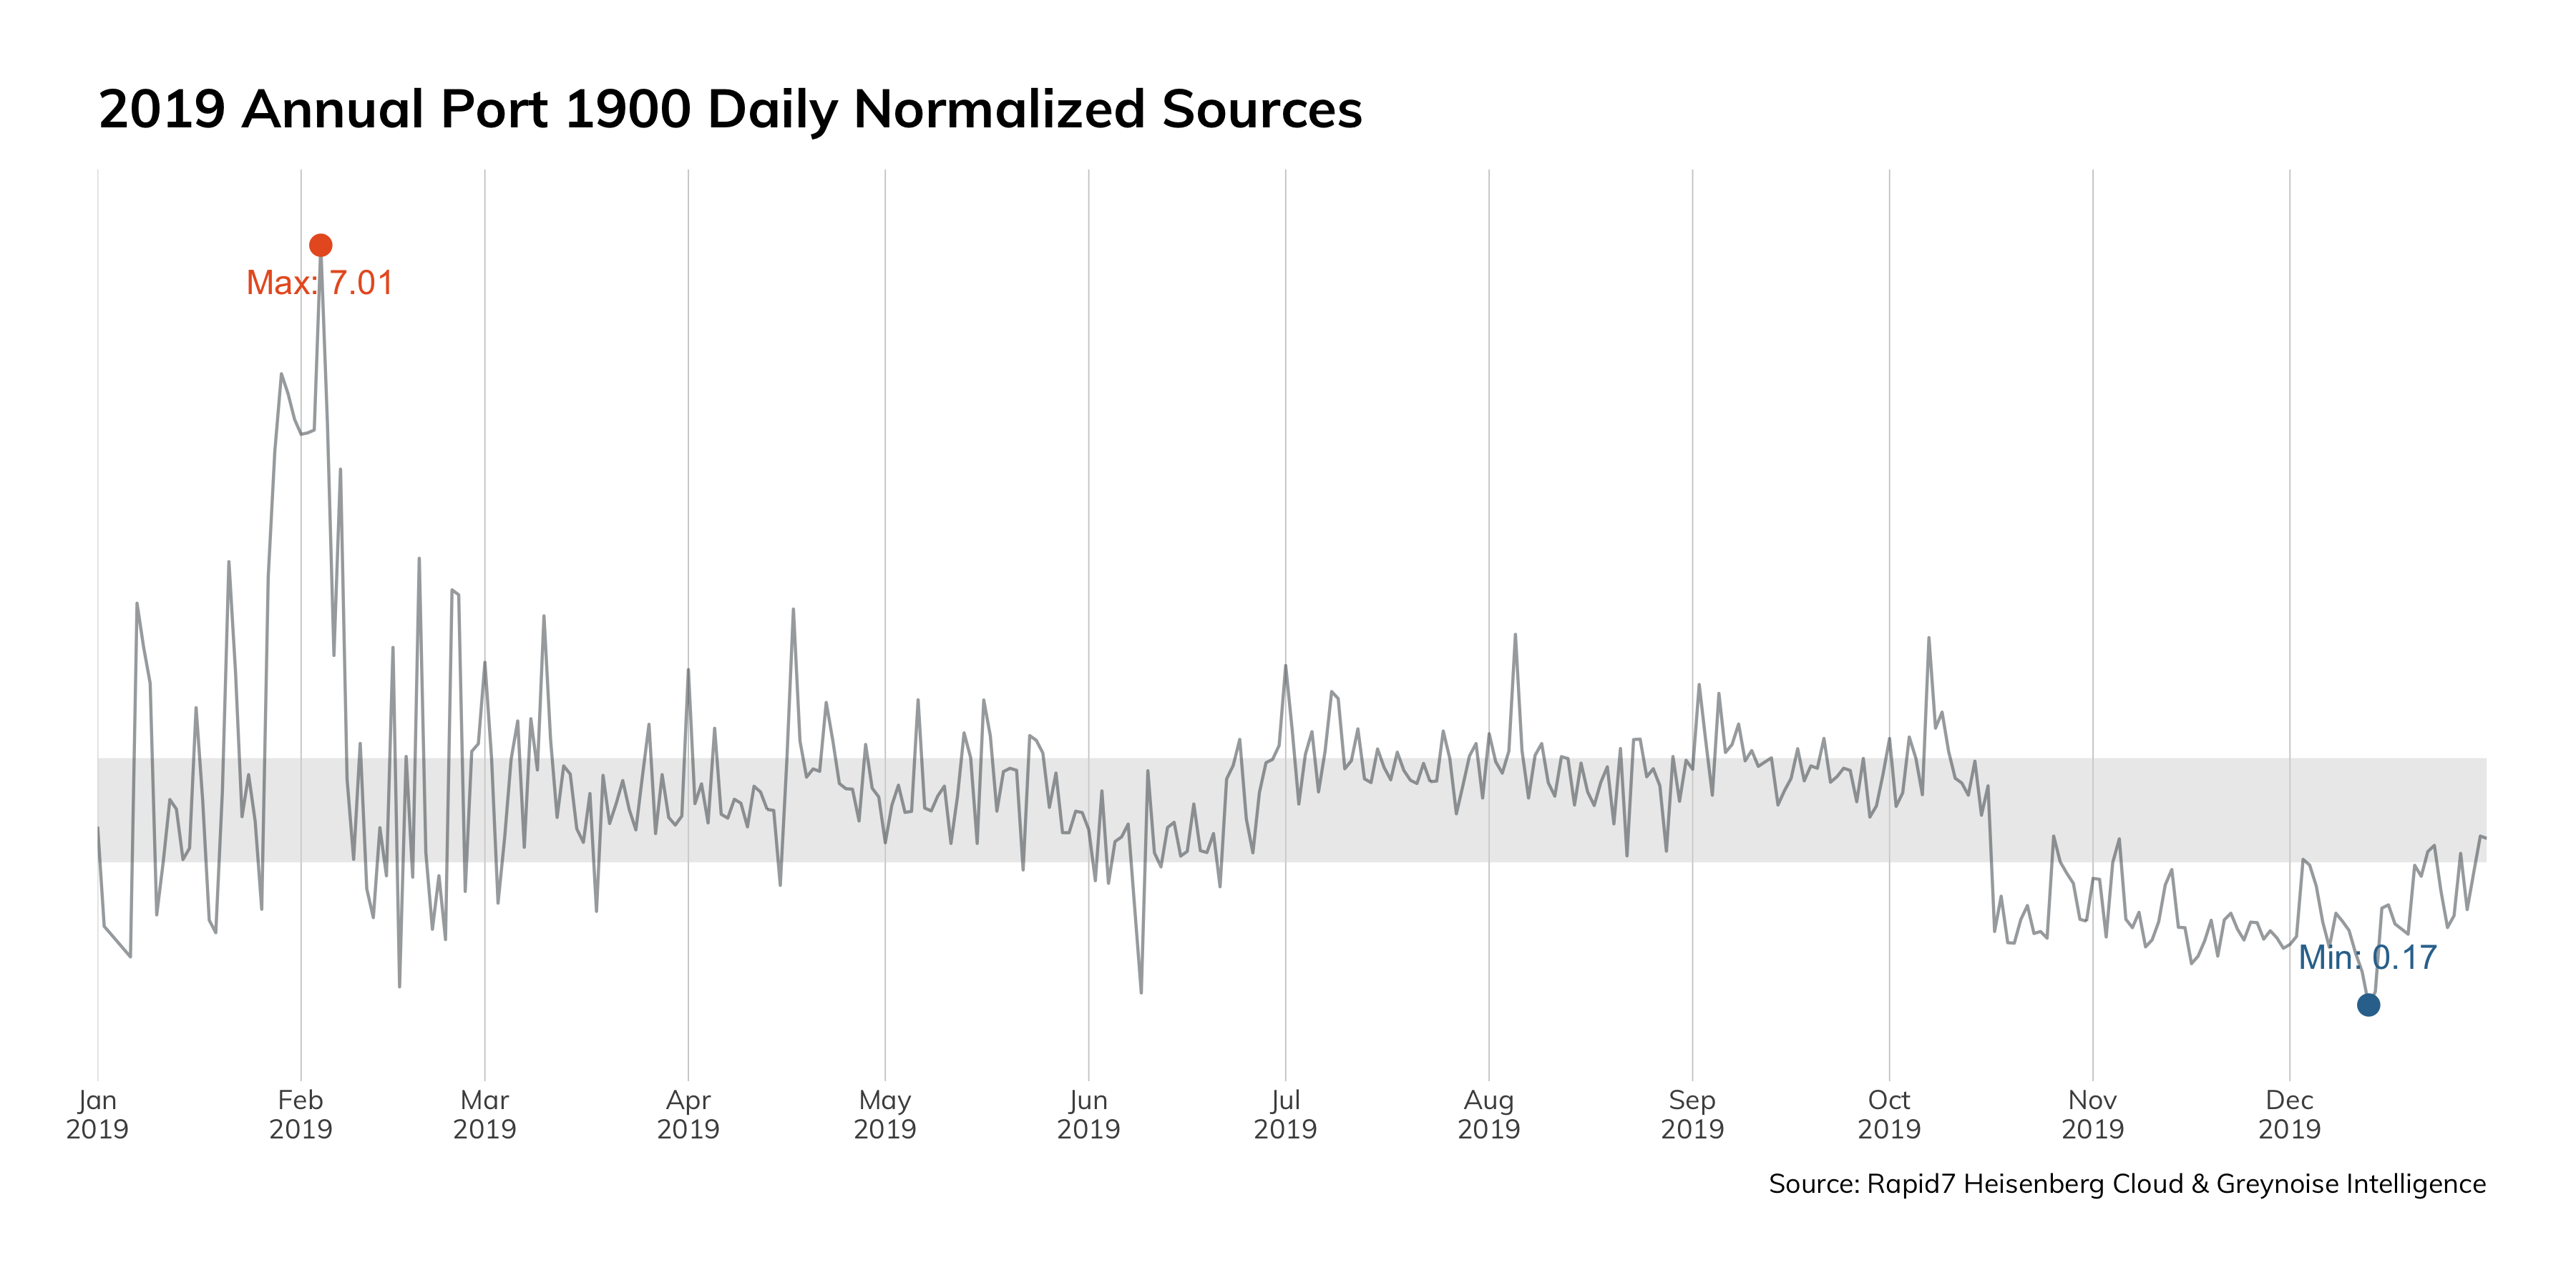
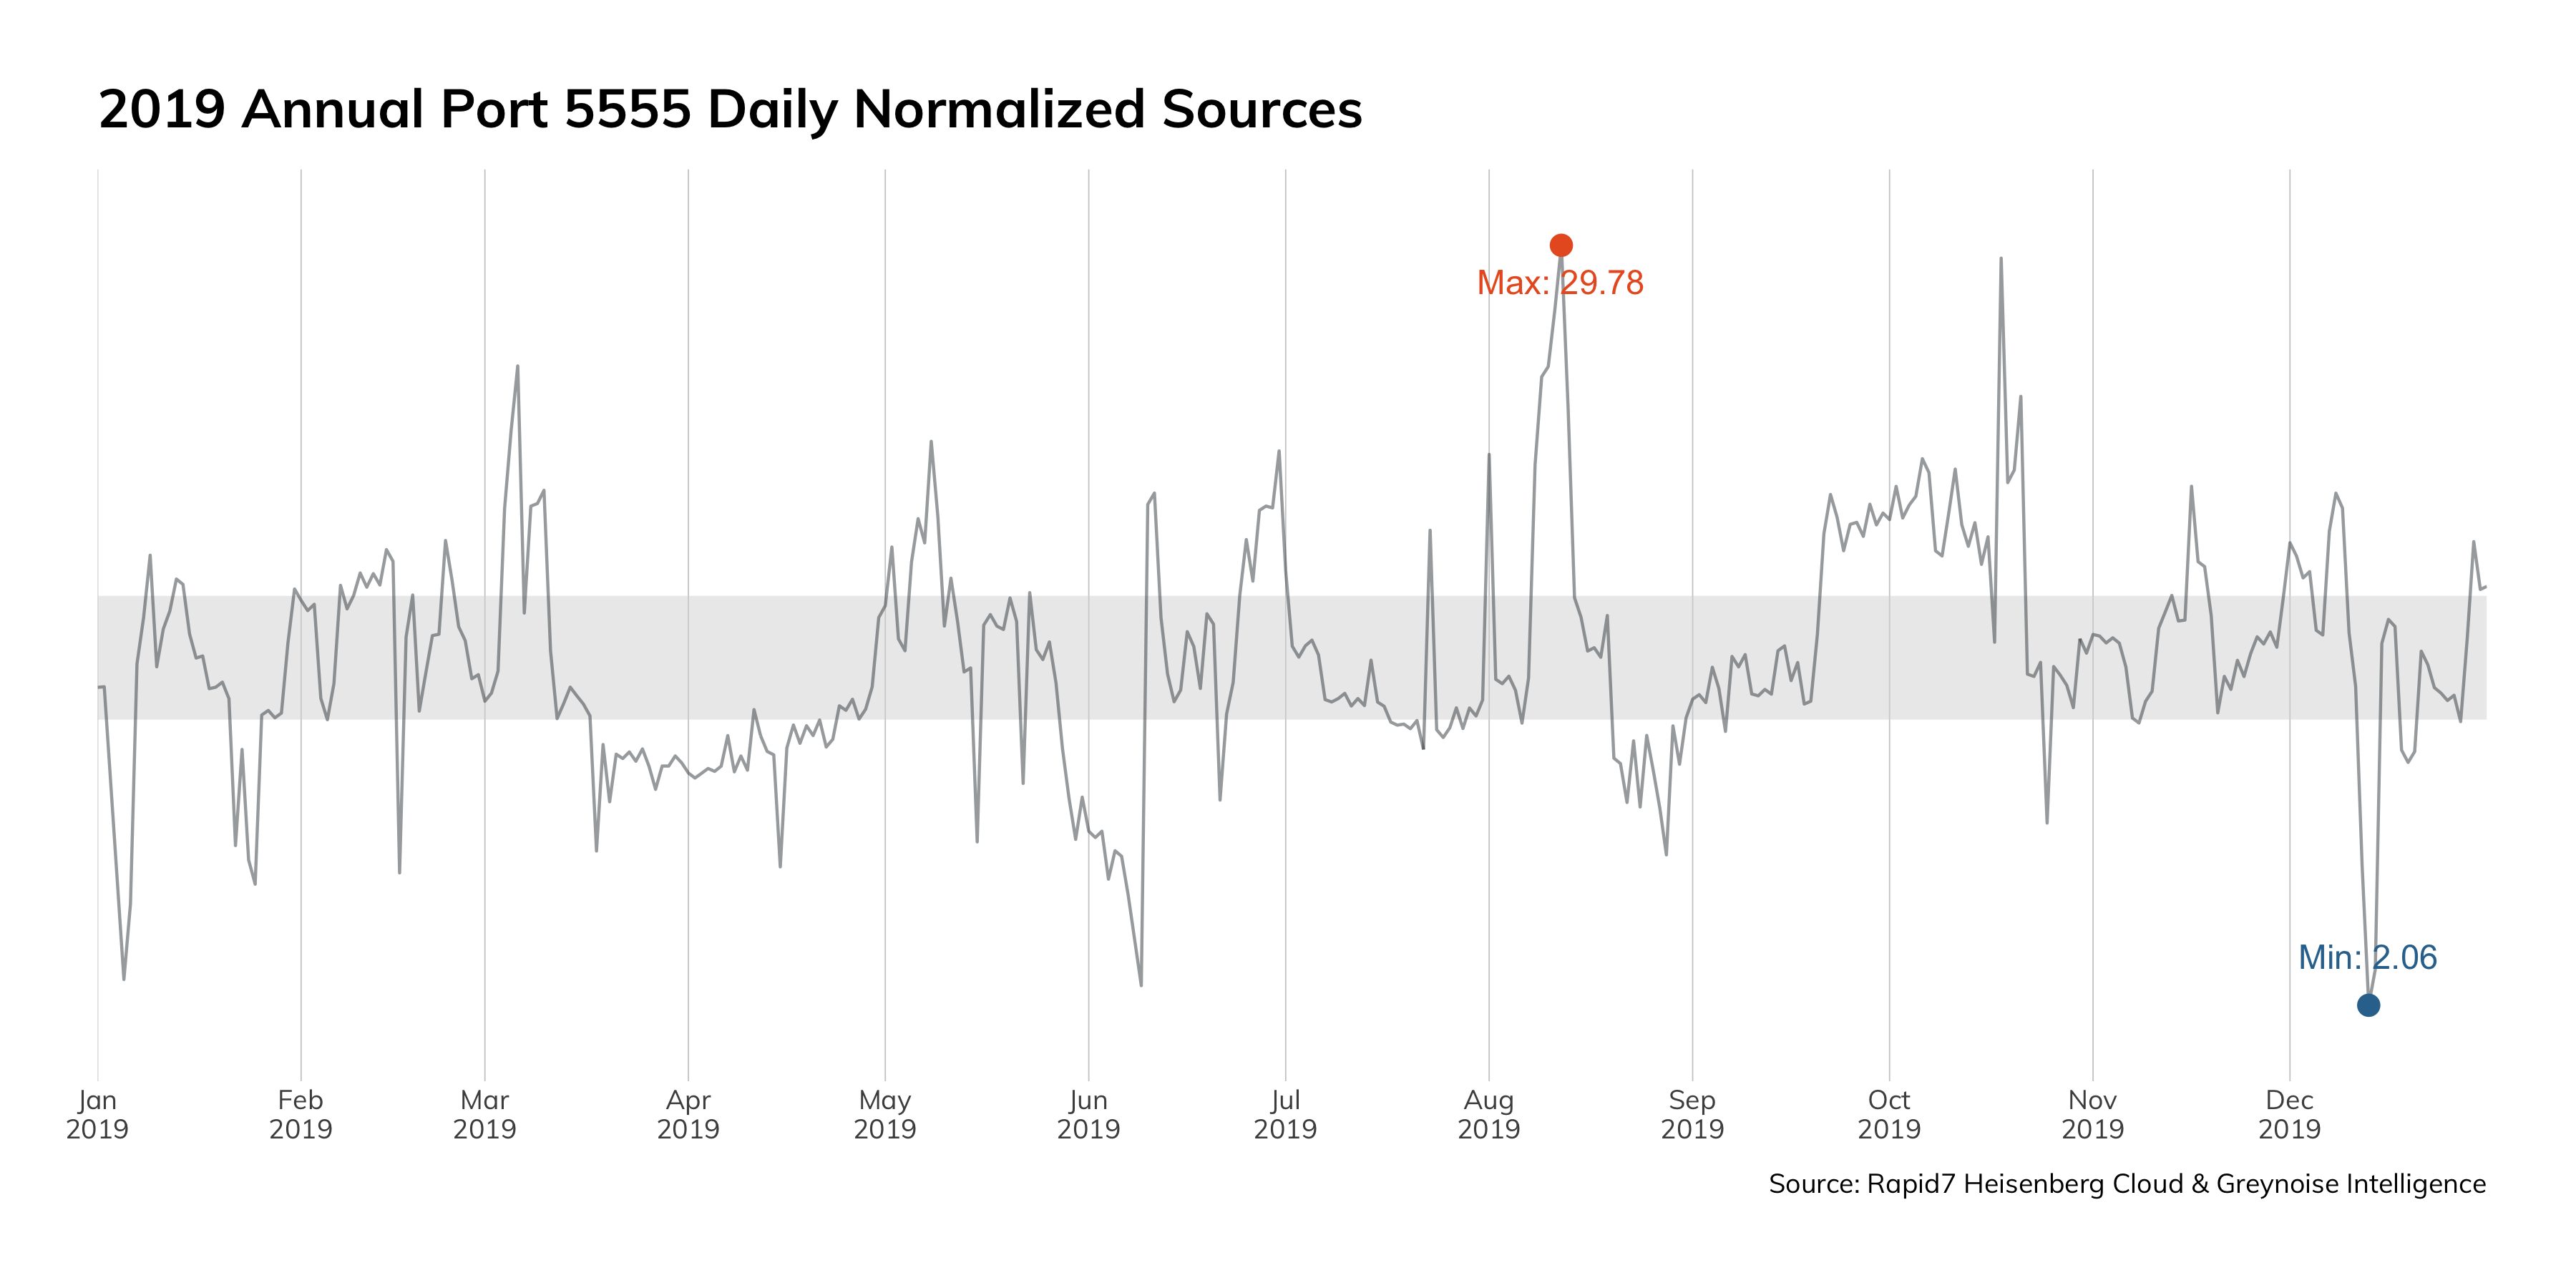
Open Ports and Vulnerable Services
We continue to see the leveling off of EternalBlue exploit attempts in our Project Heisenberg honeynet. While this isn’t shocking, the key takeaway here is that there are still so many exploitable Microsoft Server Message Block (SMB) services out on the internet that attackers still find it lucrative to hunt for them. Although this vulnerability was reported and patched in 2017, the overall population of vulnerable servers is holding steady, and therefore, holding the attention of attackers.
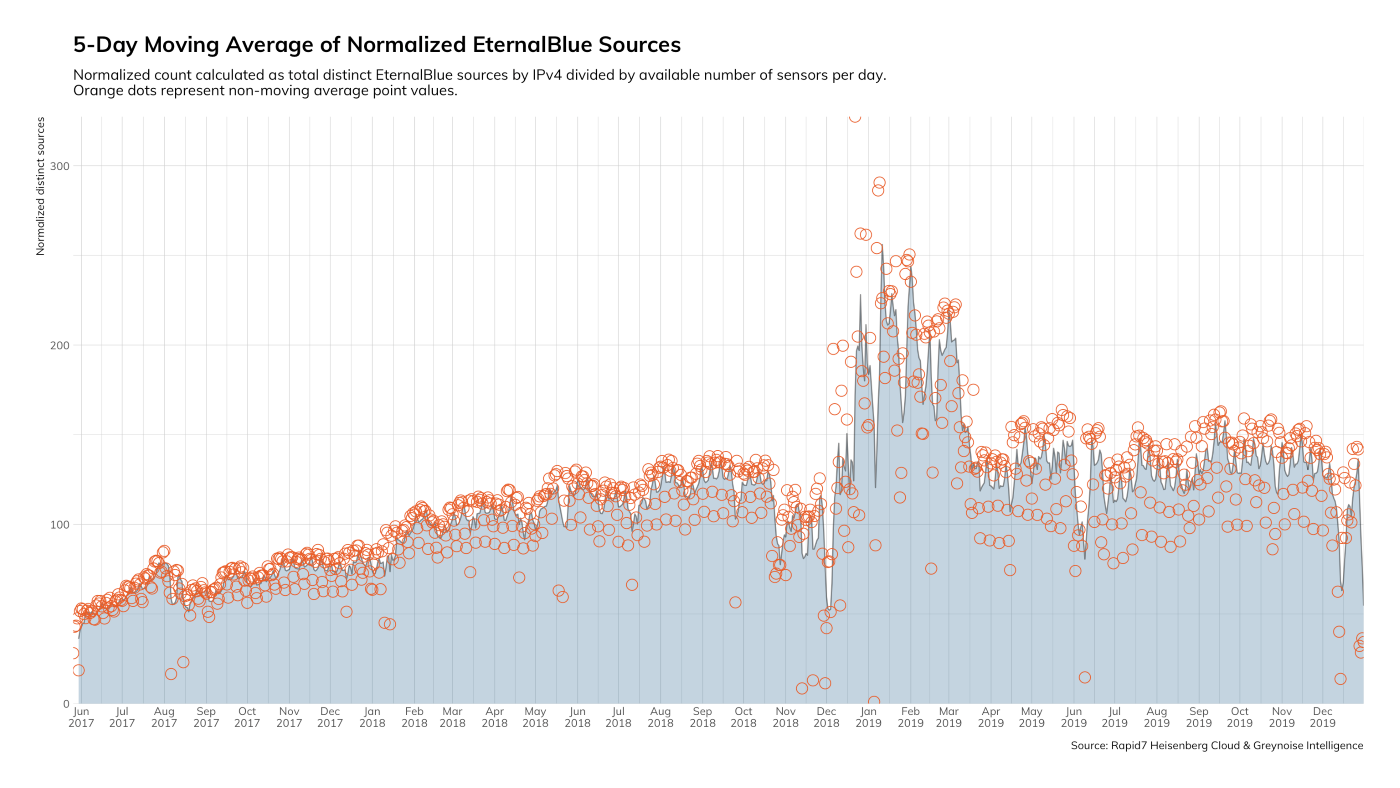
What does this mean for you?
There are two major issues to highlight here. The first is that a vulnerability from 2017 is still so prevalent that we see hundreds of exploit attempts daily. The second issue is that there is still so much SMB exposed to the internet. The best, most reliable, and free tools that we have in our arsenal are network access control and endpoint hardening. If you haven’t implemented default deny approaches to network segmentation and haven’t taken the time to harden the systems you deploy, that should be your next step.
How can you use it?
Knowing what attackers see when they look at your organization is critical in assessing where you must place your security program investments. Further, having a constant finger on that pulse on how your external footprint is changing will help you notice and manage changes that might lead to issues.
When it comes to patching, being able to effectively prioritize and justify the work you’re asking overworked IT teams to perform is critical. These IT teams want to do the right thing, they just need to know how to prioritize it against all of the other priorities they’ve been given by the rest of the business. Aligning vulnerabilities with how they are being used by attackers is the most effective way to prioritize the workload to achieve the most reduction in risk.
How can you improve your security program?
Network segmentation and system hardening are two foundational concepts of security that are as old as the network and computer, respectively. As foundational concepts, they’re all but free to implement, easy to deploy, and can accommodate variance.
Figure 3 just goes to show you how bad it is in the top ports:
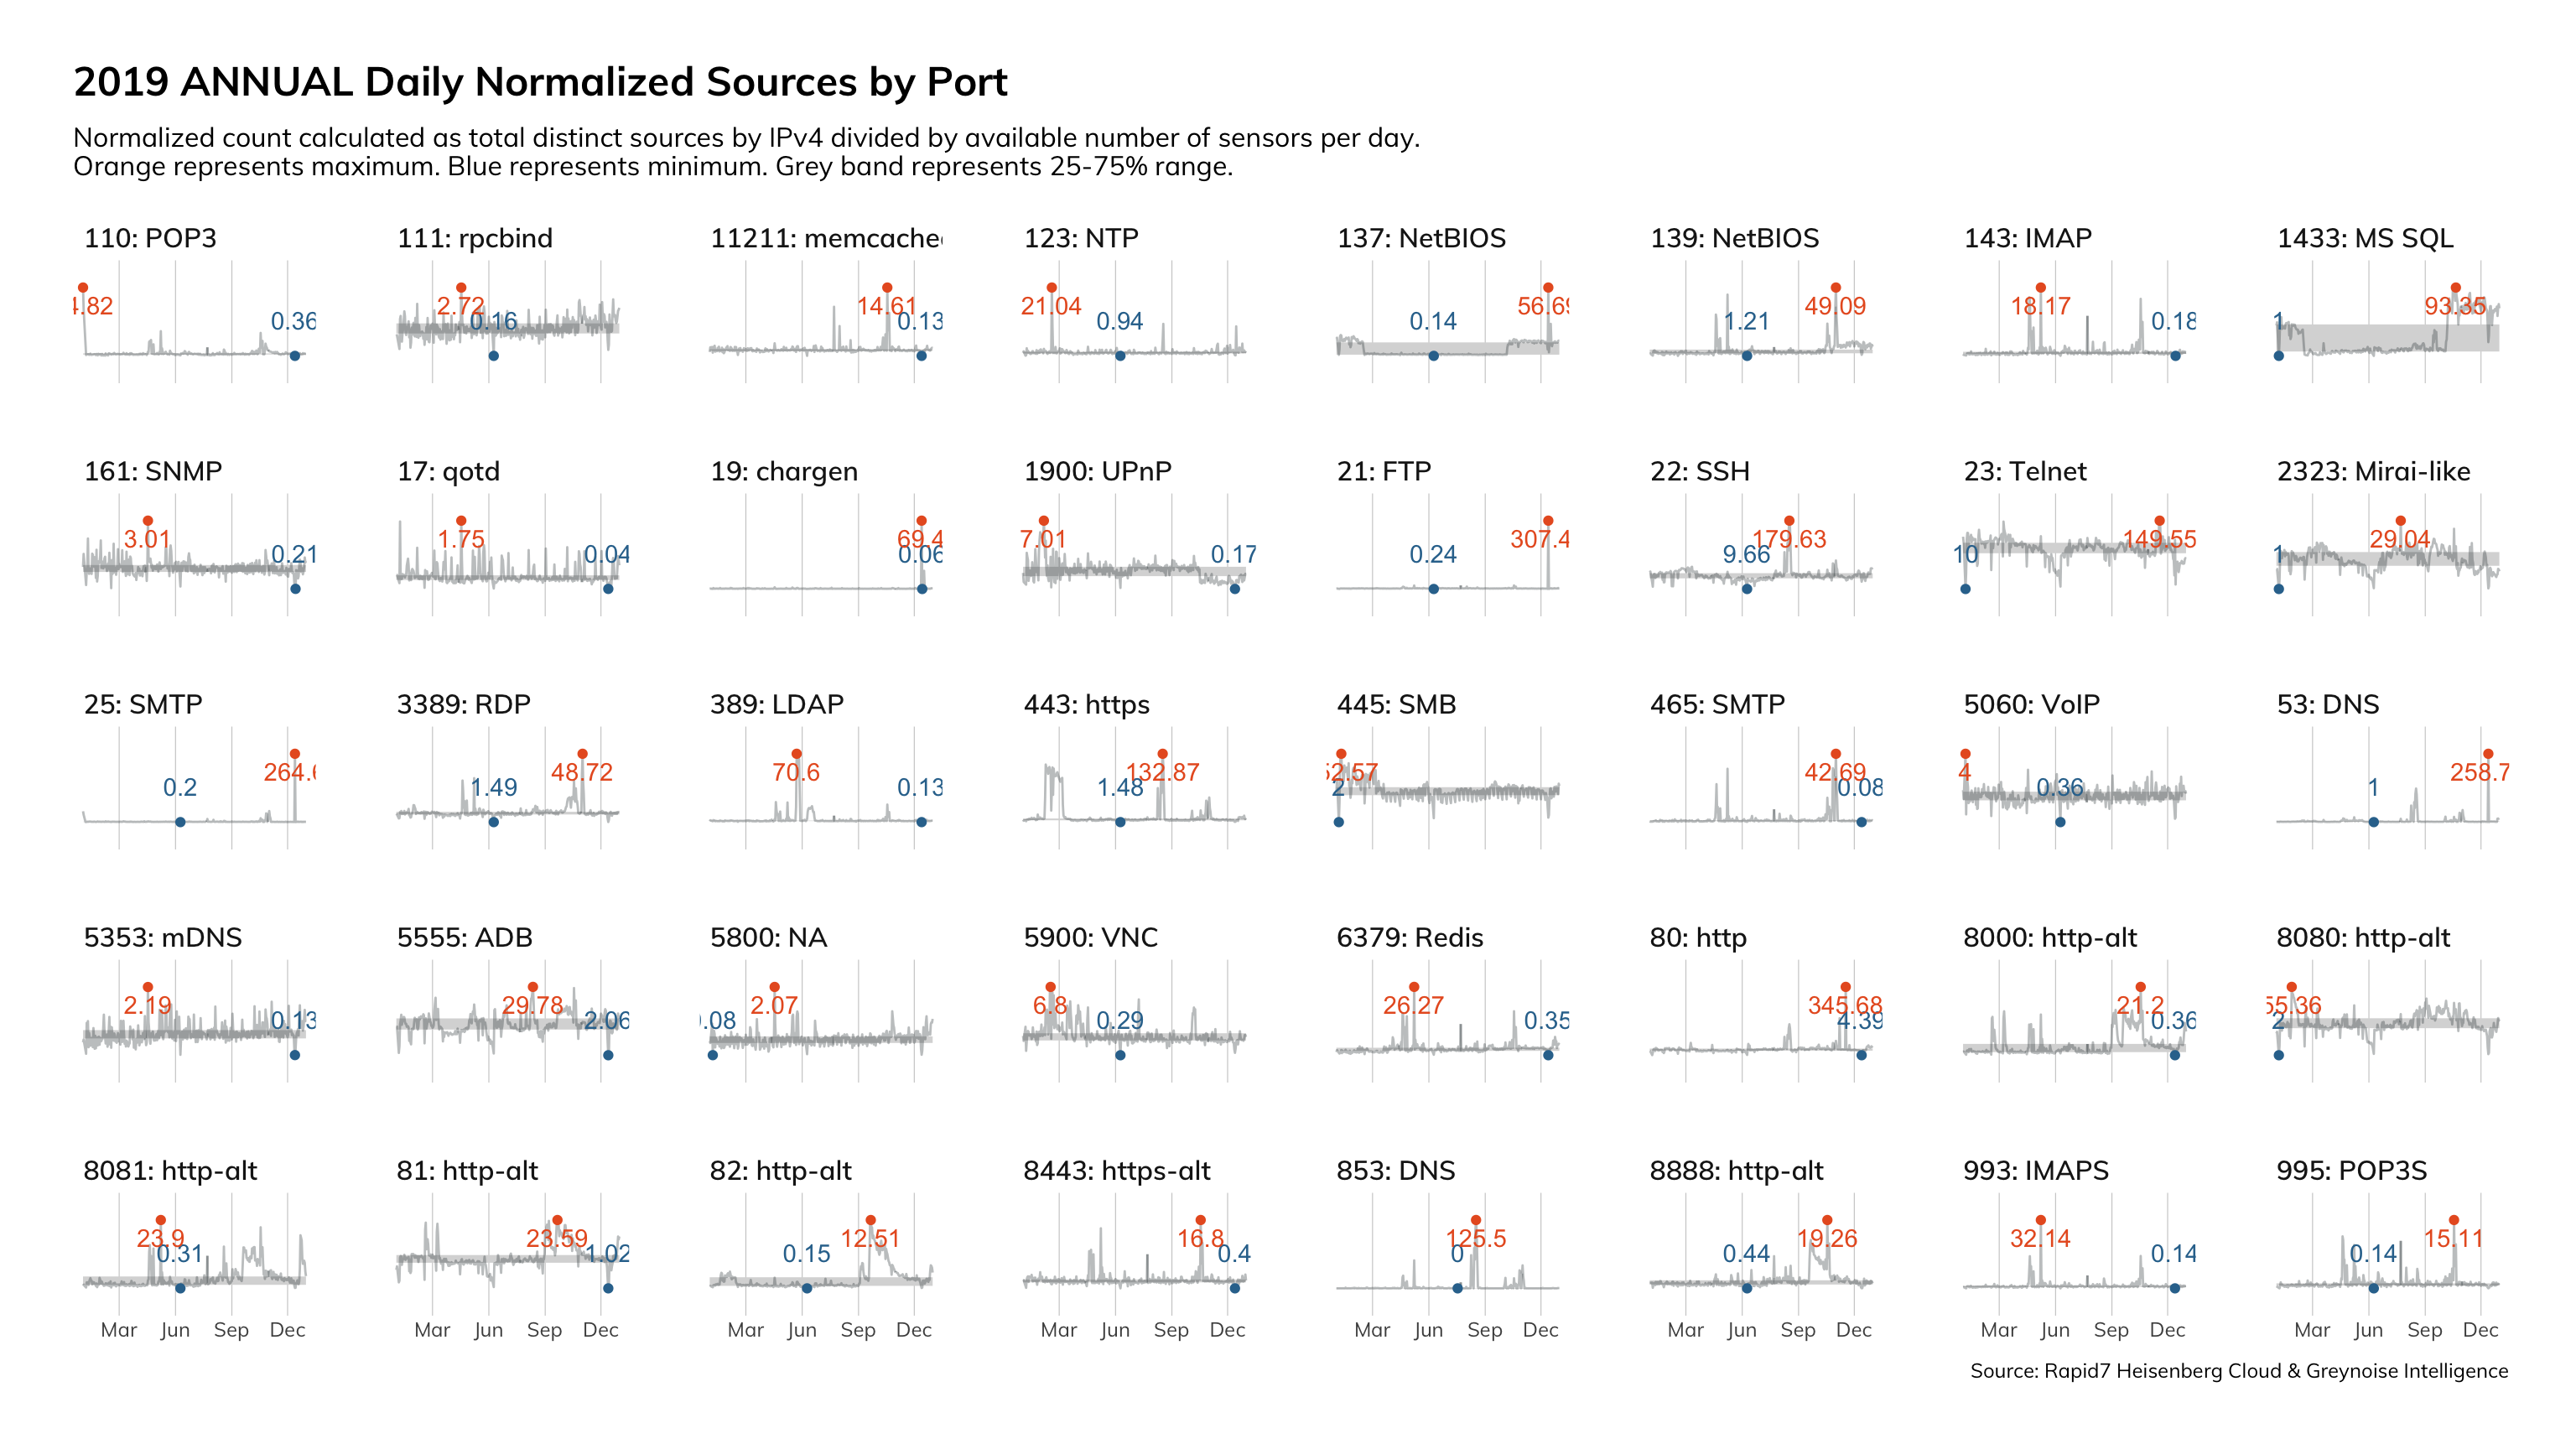
This data is from Project Sonar, and presents a frequency analysis of all the services we see on the internet. Ideally, we'd only see internet-hardened and ready services on this chart: HTTP and HTTPS, DNS, and the e-mail protocols. However, these services jump out as inappropriate for internet exposure:
One could make an argument that Remote Desktop Protocol (RDP) could be internet-ready (and be wrong; that's what Remote Desktop Gateway is for), but there is absolutely no justification for things like SMB/NetBios (Windows internal network protocols?), MSSQL (a database protocol), UPnP (and internal service-finding protocol), or ADB (the Android Debug Bridge, for administrating local Android devices).
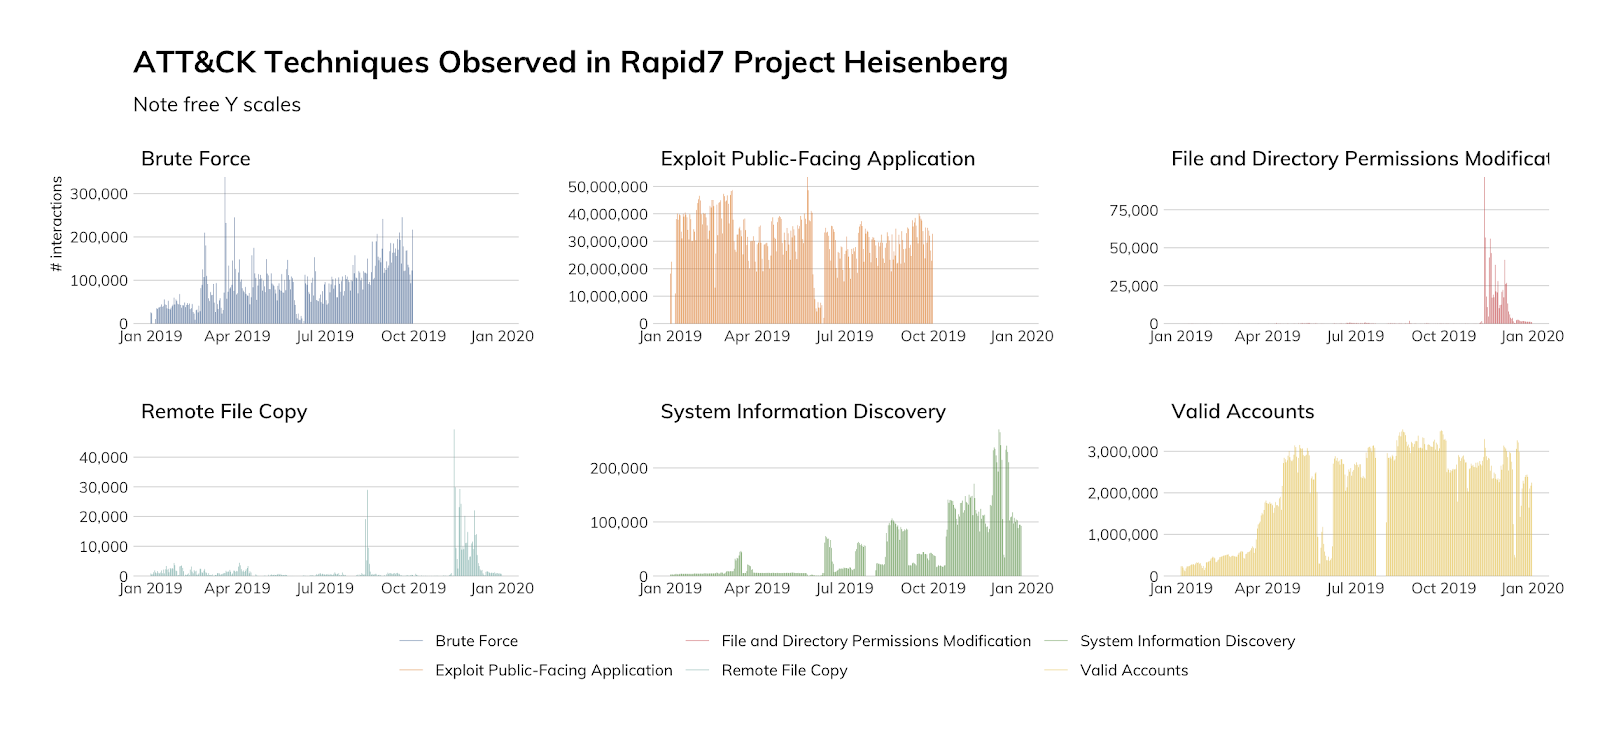
Common Threat ATT&CK Techniques
This quarter, we realigned all of the data from Project Heisenberg so that we could not only tell you about what is targeting our MDR customers, but also to better understand the common threats out there. We can clearly see the most prevalent malicious techniques utilized in our data sources. For MDR data, our top detection is valid accounts being used by attackers. For Project Heisenberg, our top detection is also valid accounts being used by attackers. We also see extremely high levels of brute-force (considered non-valid accounts) and exploitation.
What does this mean for you?
This data should be presented to your decision-makers. Help them understand that while your business might not have anything worth stealing, you have compute power, and attackers love compute power for all sorts of nefarious activity. Raw distributed denial-of-service (DDoS) bandwidth, cryptocurrency mining, or even just a safe harbor to proxy attacks from are all valuable underground commodities.
How can you use it?
We’ve established that we all know the internet is a place full of little critters just waiting for their chance to chew off a bit of our bytes. Even knowing that, where do you focus? Trojans? Worms? Exploits? Valid accounts? Well, this data clearly indicates that in response to the common threat, you should be prioritizing user account safety, patching, and automated solutions to detect and terminate brute-force attacks.
How can you improve your security programs?
Mitigating against unauthorized use of credentials is table stakes for any security program. Being able to reliably control and audit credential and authorization use is a foundation of the confidentiality, integrity, availability (CIA) triad. Further, many of the tools you will use to authenticate authorized users are already built into your enterprise IT tools. The issue often becomes that security and IT teams don’t have clear guidance on what they need to protect and where those assets are. Investing time in building a data catalog and improving your asset inventory will provide that clarity. User education around what data is most important to the organization will ensure that secure habits become everyone’s intention.
IT teams are often hesitant to fully participate in mitigating vulnerabilities with patching. When you look at the world from their view, you can understand why: overworked, under-appreciated, and always blamed. However, when we’re able to prioritize the work for them based on impact and justify the work by demonstrating how risky not doing the work is, we’re often able to work together for positive outcomes.
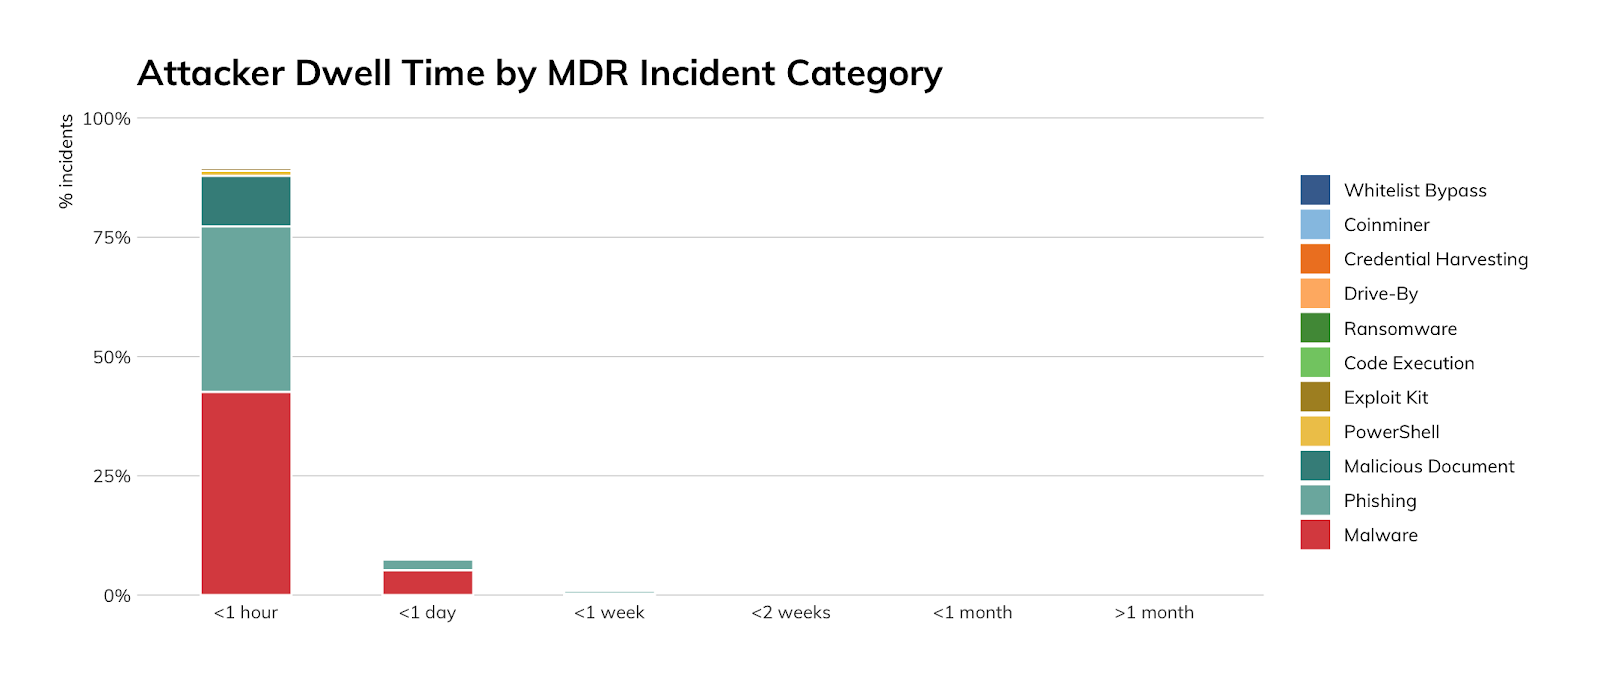
Attacker Dwell Time and Incident Category
We see the data reflected from previous quarters in the annual data. Our MDR team continues to maintain a respectable record of identifying threats before they become an issue for our customers. Additionally, we see that attackers are favoring malware, phishing, and malicious documents; these three categories alone account for almost 80% of how they attack organizations.
What does this mean for you?
The data that goes into this Threat Report comes from our MDR team who monitor several hundred customer environments totaling over a million endpoints. The team employs a number of different methods to detect attacks, including monitoring endpoints for attacker behavior, leveraging indicators of known threats, threat hunting in the InsightIDR data set, and User Behavior Analytics against log data.
Additionally, we see that by focusing our efforts on preventing and detecting malware, phishing, and malicious document threats, we can make a big difference in the risk and impact of future attempts.
How can you use it?
While our approach to threat detection is considered to be mature, it’s certainly not out of reach. Our detections and intelligence are derived from both the work that we do and the information shared throughout the infosec community. Any security program can achieve this and raise their effectiveness. The data shows that investing in measures to combat malware, phishing, and malicious documents should be at the top of everyone’s list.
How can you improve your detection program?
We present these metrics to help highlight the success of our approach. Here are some considerations to raise the game on your detection program:
- Buy/build attacker behavior detection capabilities. There are a number of different products and product categories that can monitor endpoint, network, and log data for evidence of attacker behavior. These tools complement your existing threat prevention technology (like anti-virus and firewalls), and your threat intelligence-based detection (like intrusion detection system (IDS) and application whitelisting) and also provide much of the data to fuel threat hunting.
- Buy/build user behavior capabilities. There are a number of different products and product categories that can monitor the use of credentials for anomalies. Know that this methodology generates a lot of false positives during the training period, but it is gaining in importance as attackers move away from malicious software into PowerShell and living off the land style attacks (as highlighted in our Q3 2019 Threat Report).
- Develop threat hunting capabilities. Threat hunting requires knowledge of attackers, how they operate, the evidence they leave bobbing around, a way to aggregate that evidence, and tools to wade through the data. It’s an advanced capability that requires maturity both from people and technology.
- Gain both real-time and deep endpoint visibility. There are some things that happen on an endpoint that security professionals need to know about, and there are some things that you look up on demand when you have questions. A good endpoint detection and response (EDR) solution does both.
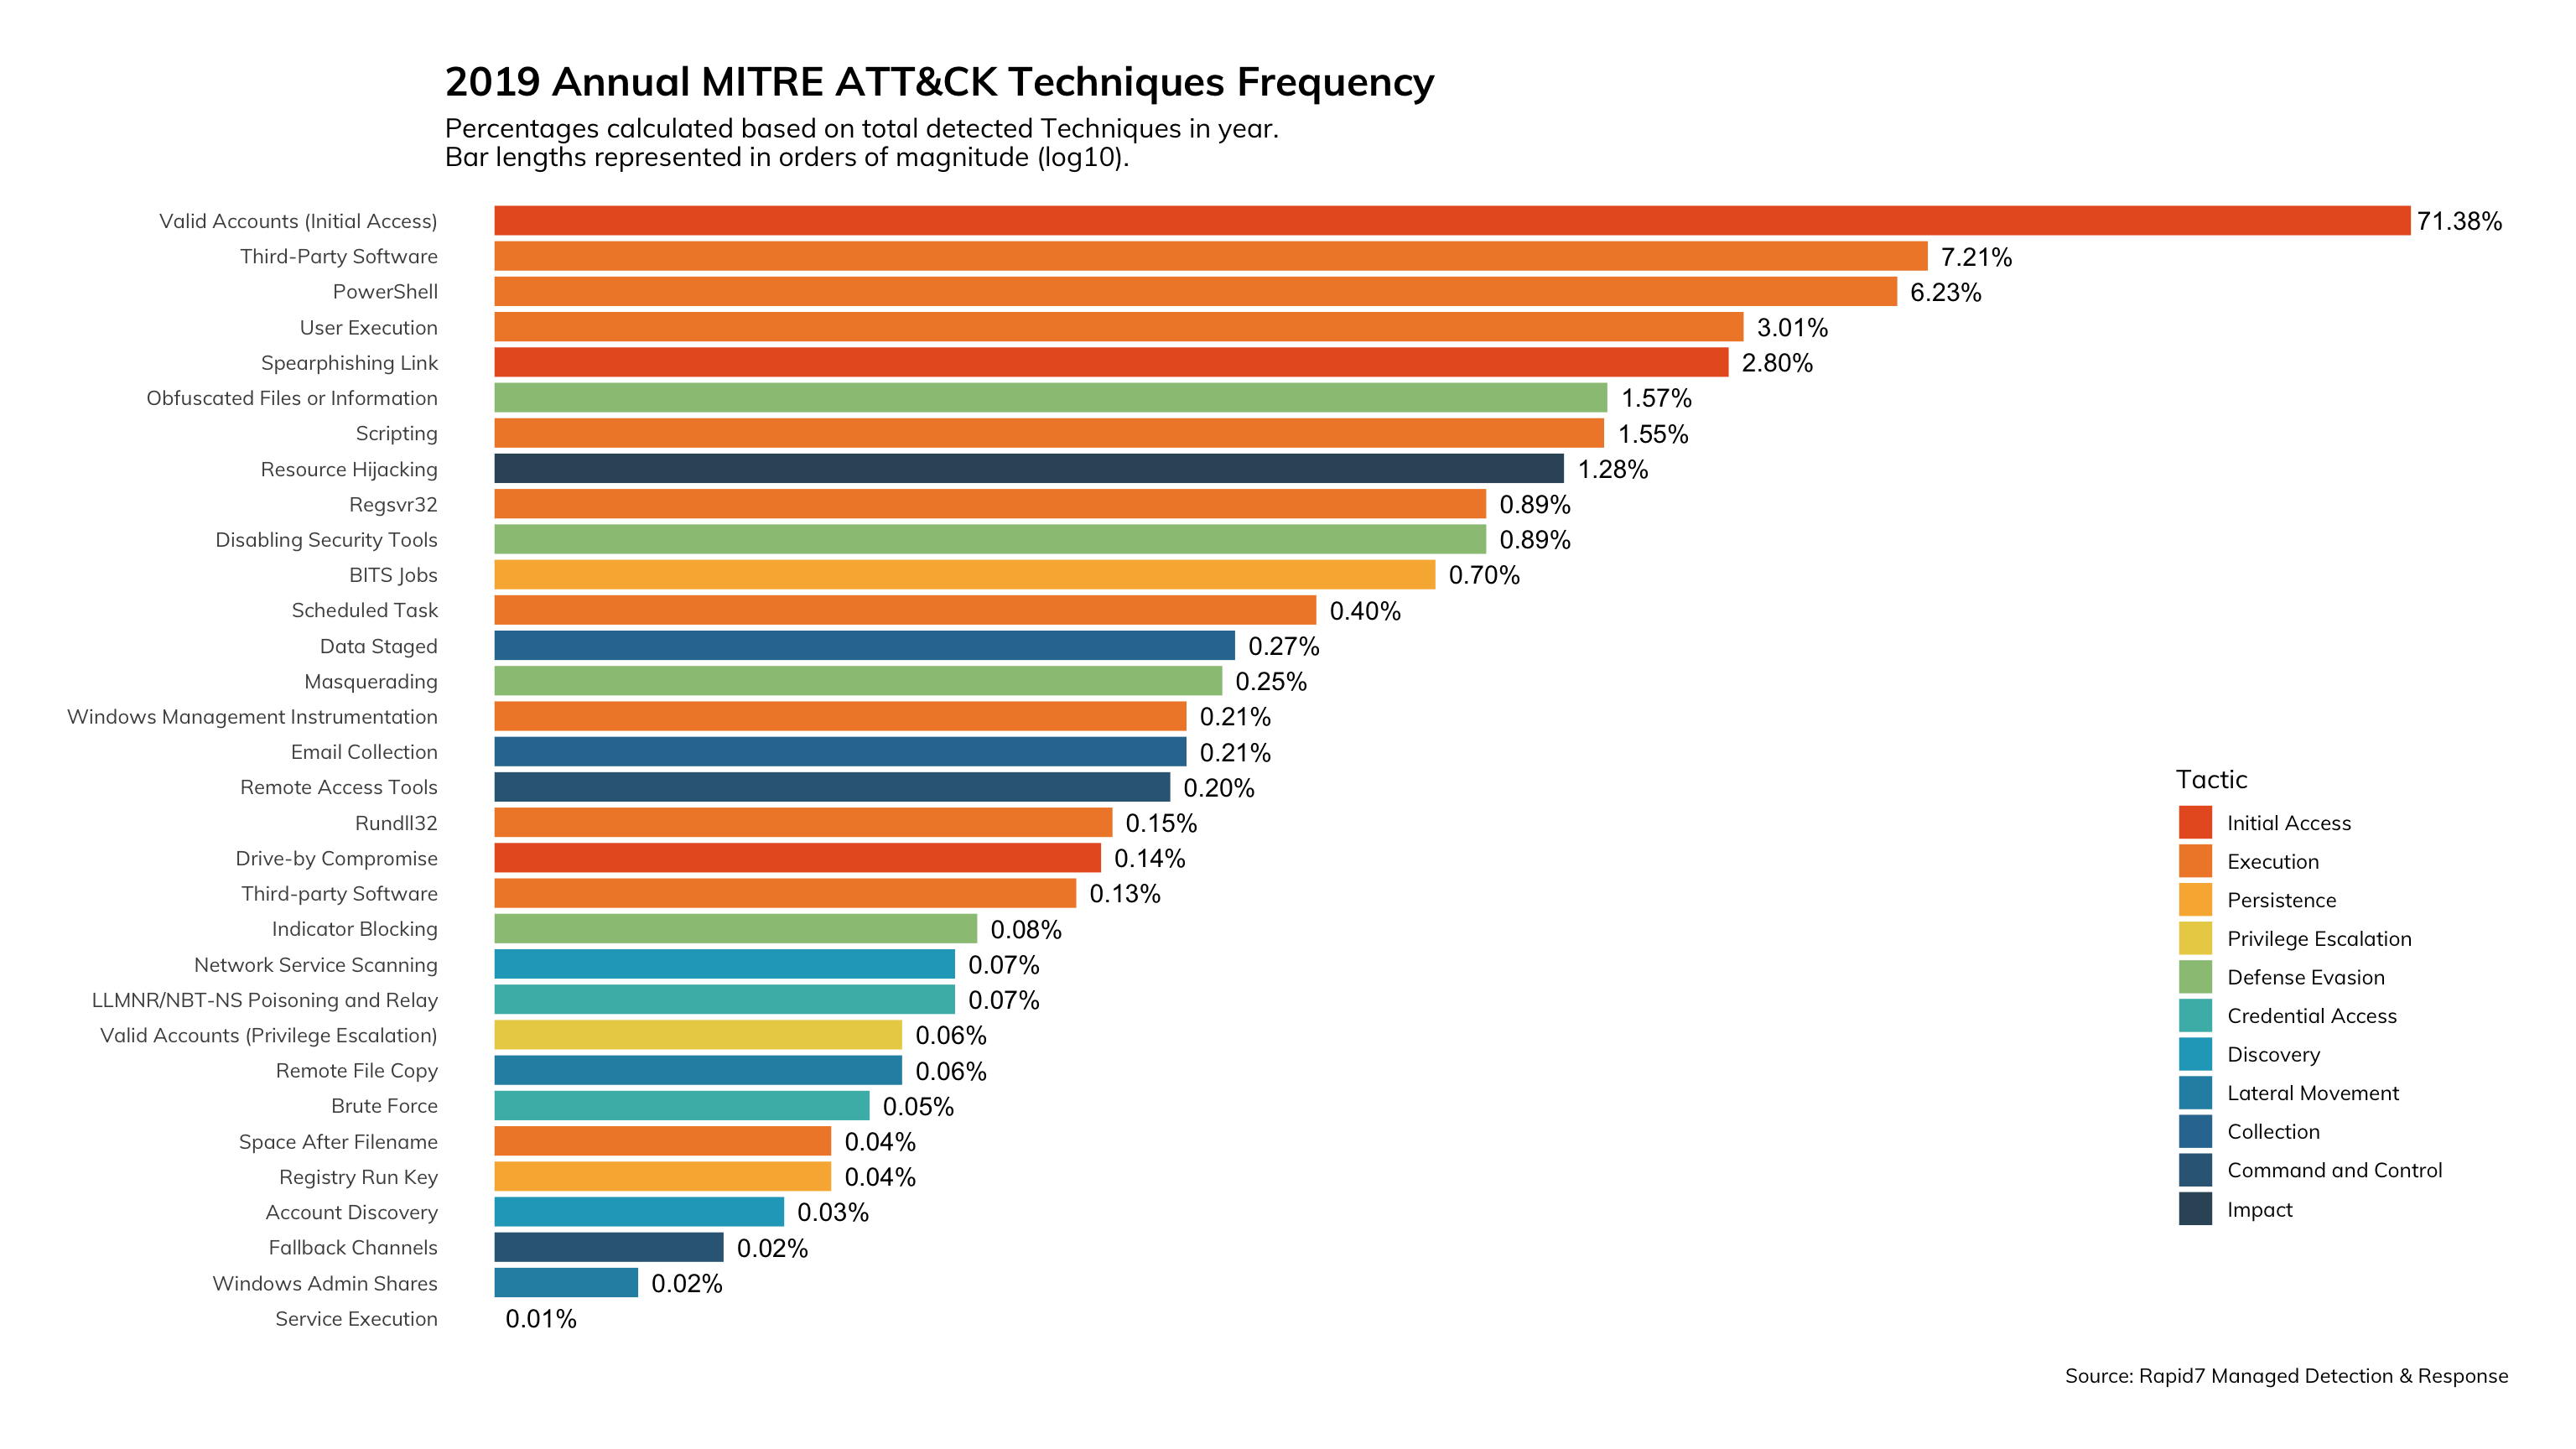
ATT&CK Technique Frequency
We continue to see the payoff of focusing on detecting the use of stolen credentials and attacker behavior on the endpoint. You can see the color distribution in Figure 12 leans heavily into the reds and oranges indicating that most of the time, we’re detecting attacks very early in the attack lifecycle and are able to quickly help organizations remove the threat and perform any recovery actions.
What does this mean for you?
This is validation that the combination of detection methodologies like UBA, Attacker Behavior Analytics (ABA), traditional threat indicators, and threat hunting work to reduce the overall dwell time of the attacker. Additionally, investing in detecting what the attacker is doing on the endpoint opens up nearly endless possibilities in identifying a breach before it causes damage.
How can you use it?
If you are not doing so already, this data can help you justify investment in EDR tools. The entire premise behind the MDR offering is that if we can see how attackers are interacting with hosts and authenticating, then we can follow just about everything the attackers do. Looking back at 2019, the data shows that this premise definitely has helped slash attacker dwell time and contain threats before they're able to pull of further attacks.
How can you improve your security programs?
As you’ll recall from the Q3 2019 Threat Report when we featured PowerShell and living off the land techniques, most of the malicious activity that we observe happens out of sight from most security tools by leveraging what is already available in the Windows operating system. The only way to counter these attacks is to reduce the attack surface by limiting the capabilities of the Windows scripting languages, limiting the number of administrative tools installed on regular workstations, and monitoring process execution to look for attacker behavior.
ATT&CK Tactics by Industry
Figures 13 and 14 provide another view around timing of detections. The horizontal axis of the graph represents phases of the attack lifecycle that generally proceed along a fixed timeline. For all industries, we see the MDR team detecting attacks early in the lifecycle and thus reducing the impact of the threat to business continuity.
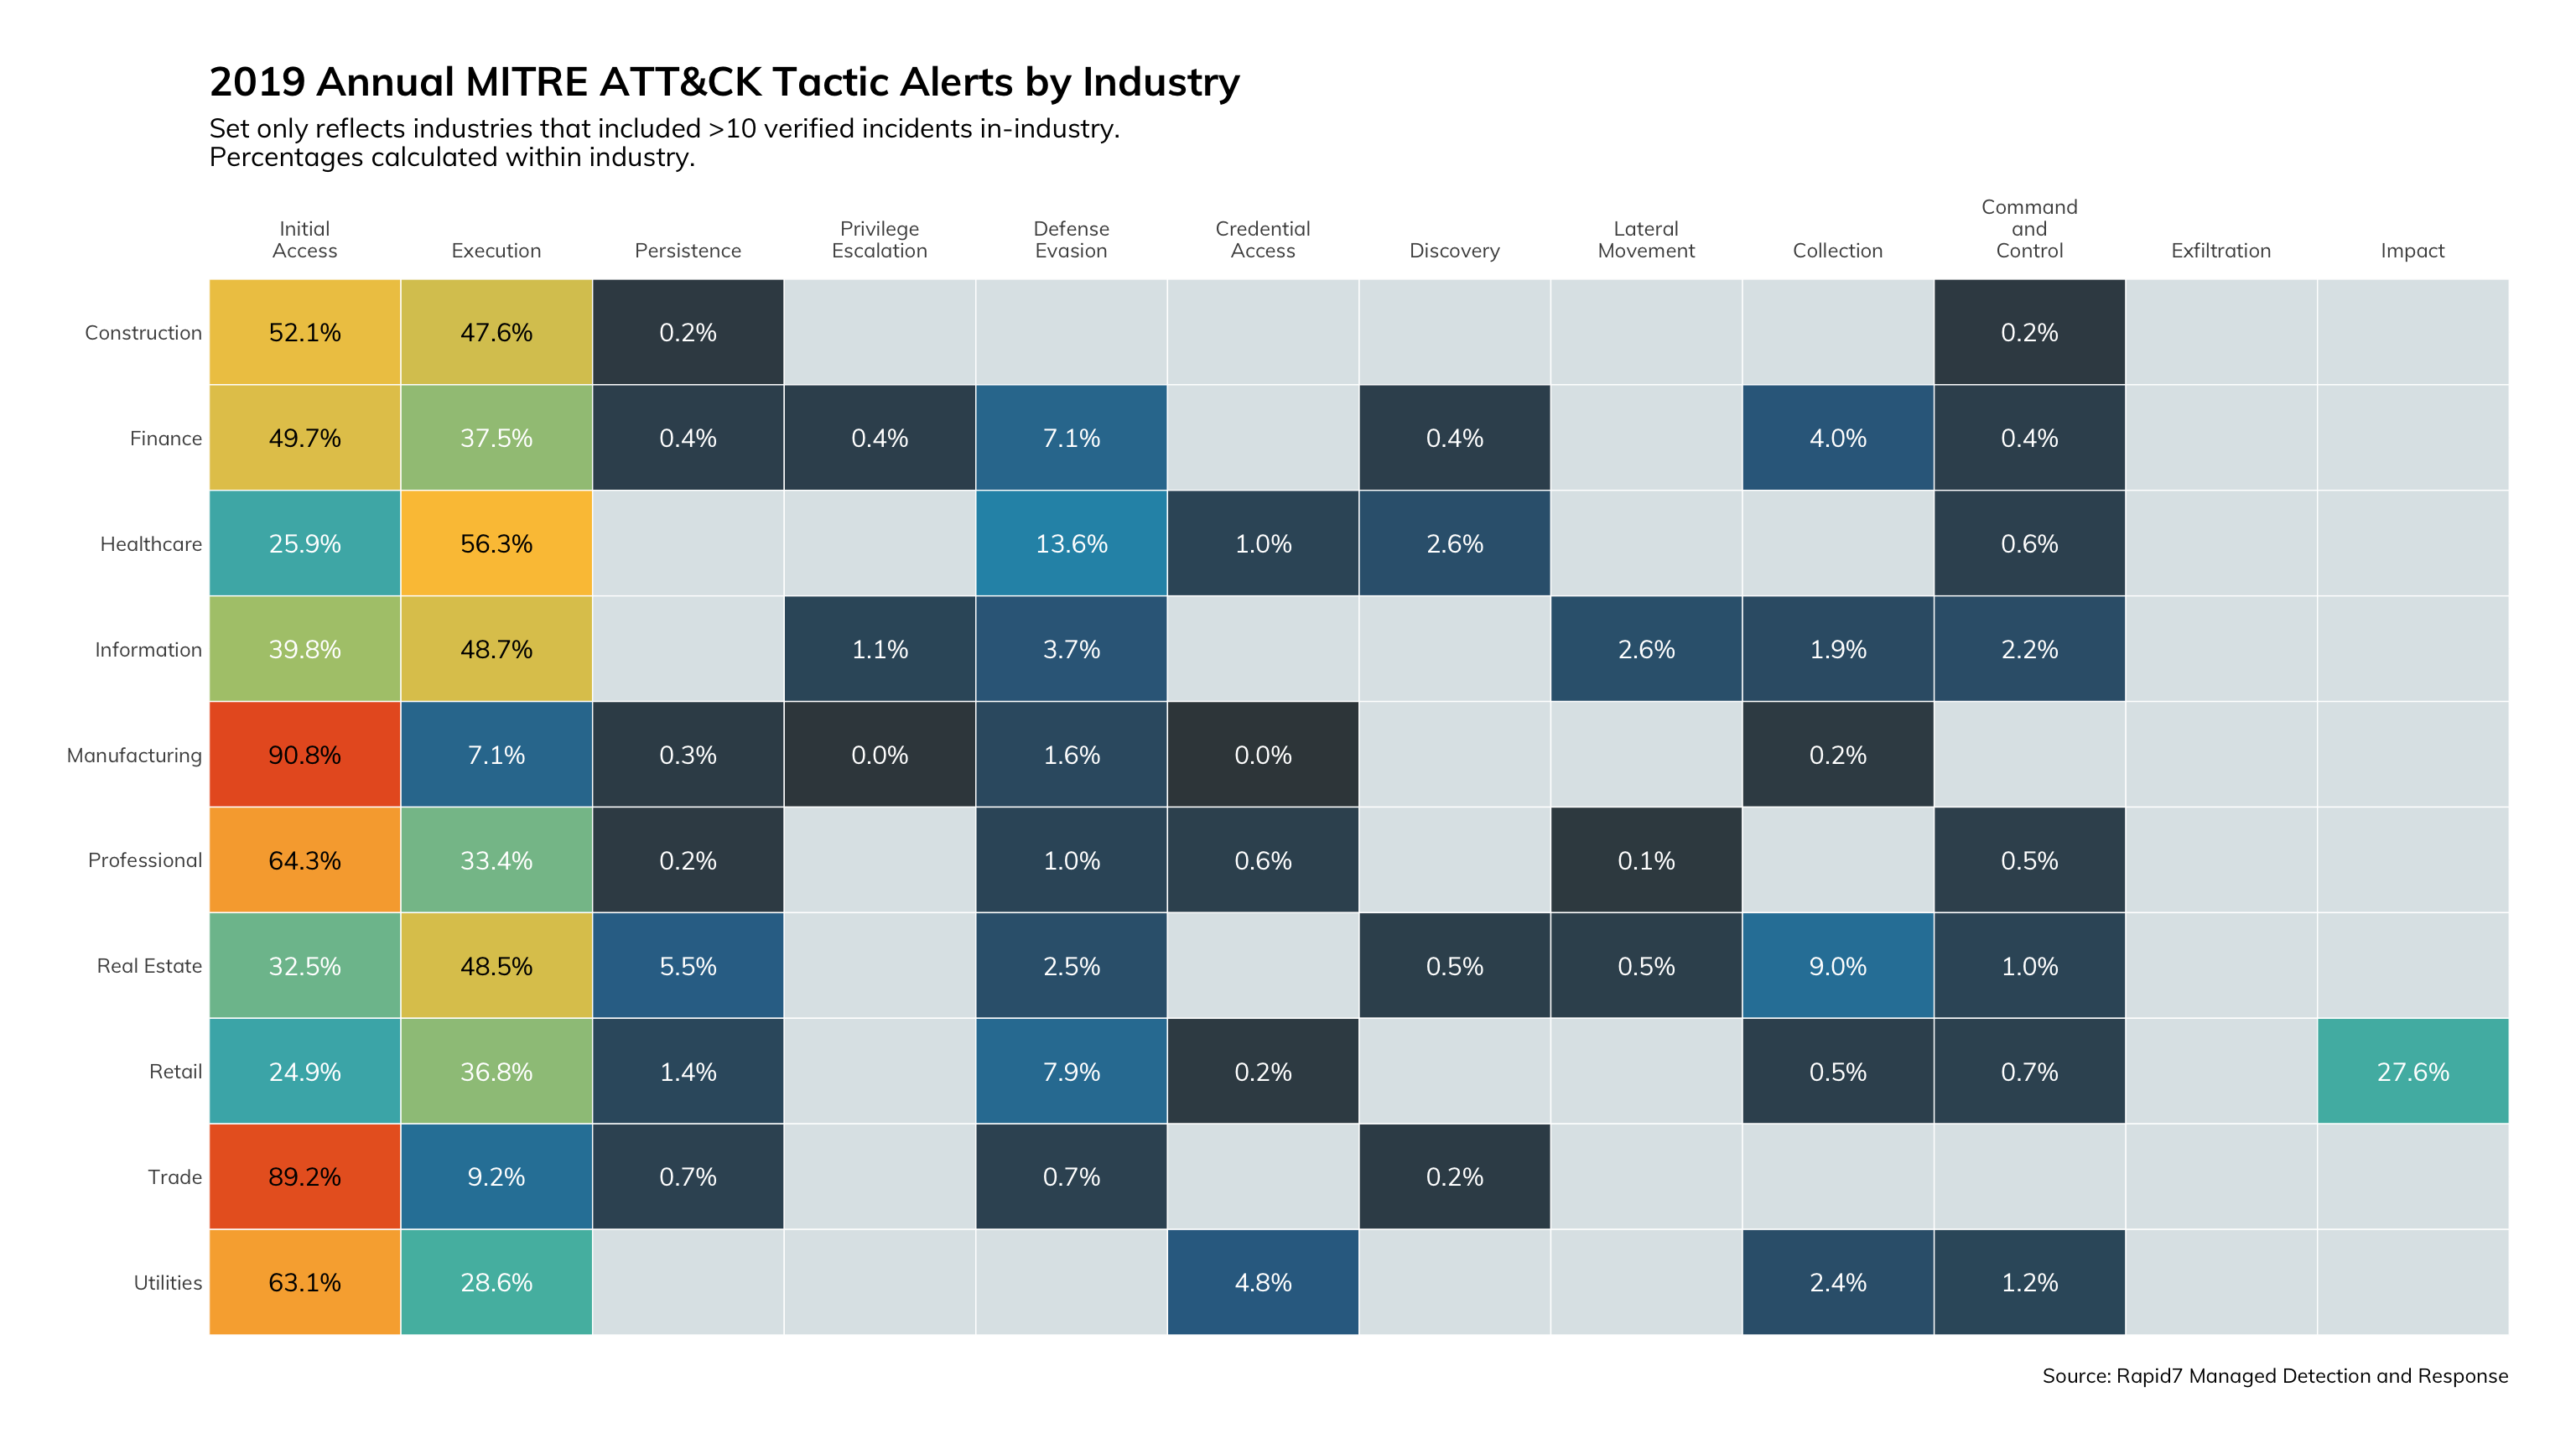
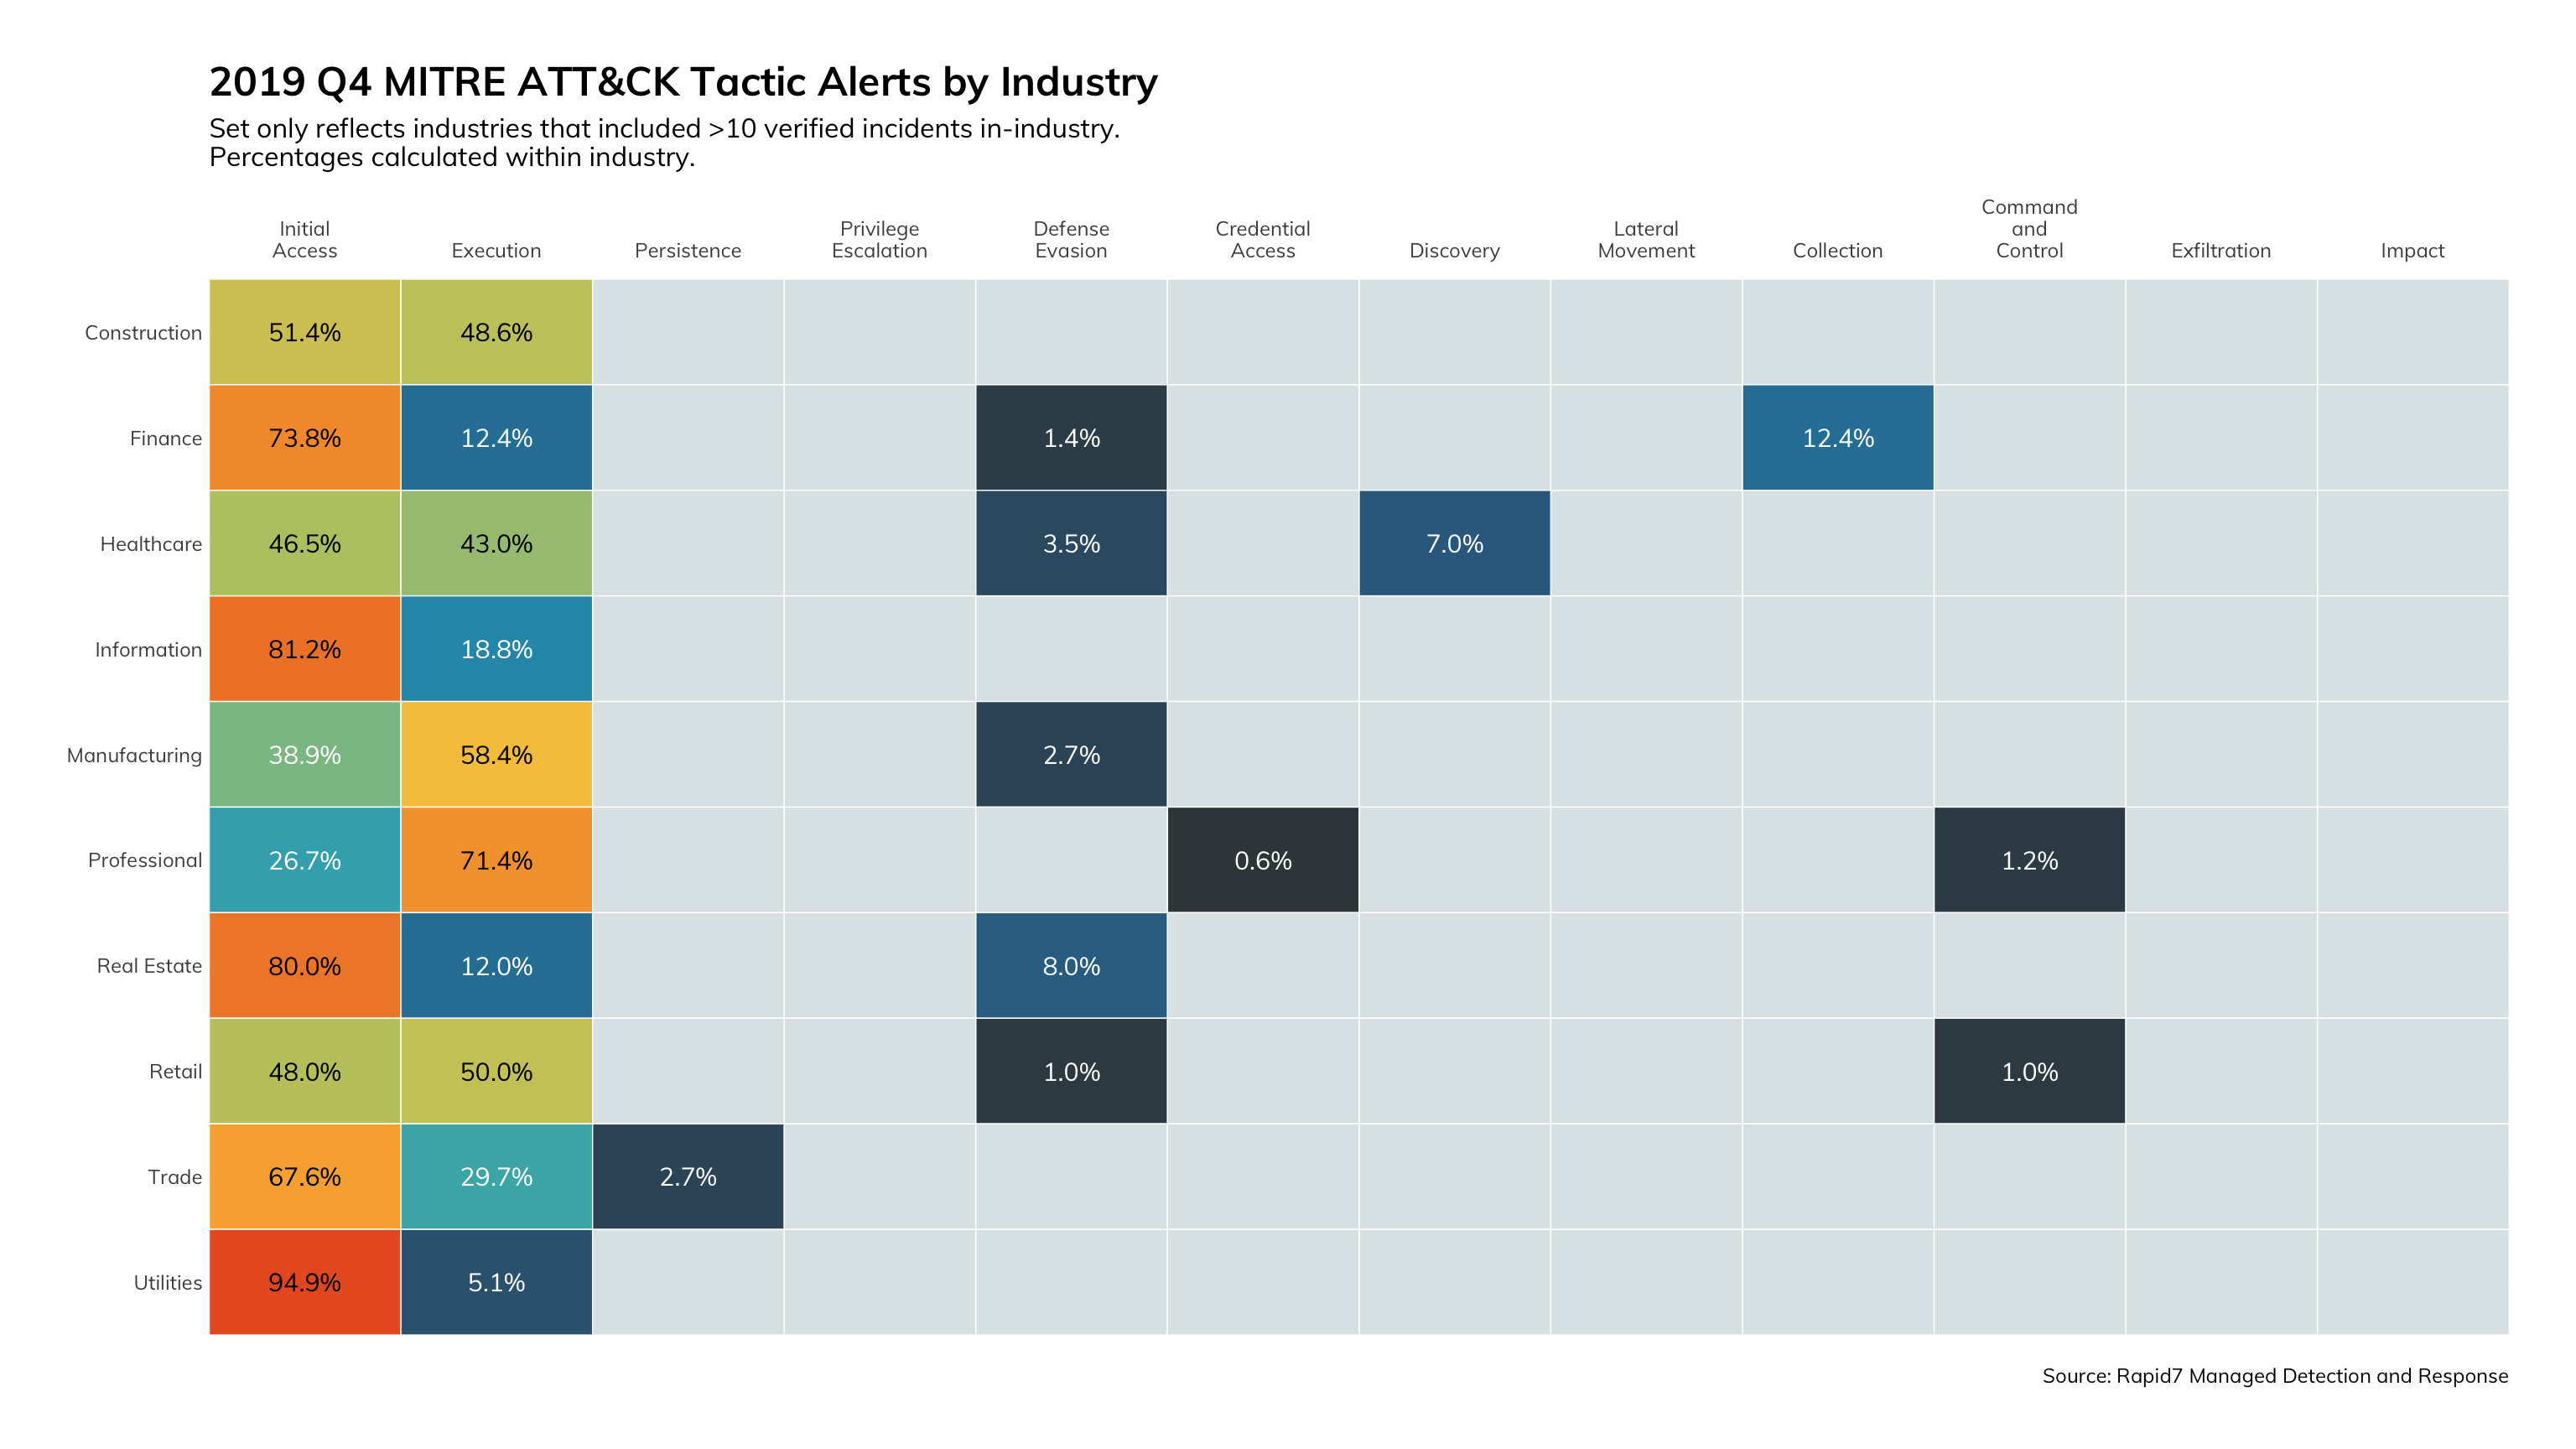
What does this mean for you?
This kind of data can help you decide where to prioritize your investments. You know that you need a layered approach to effectively detect threats, but you need to know where to apply these investments for the best return. The data shown in Figures 13 and 14 clearly indicates that a focus on detecting attacks early in the lifecycle shortens the attacker dwell time and costs businesses less to remediate.
How can you use it?
If you are measuring and classifying your prevention, detection, and response findings according to the MITRE ATT&CK Enterprise Framework, you can not only understand how far attacks are getting, but also which specific techniques are being used so that you can mount an effective defense.
How can you improve your security program?
In the industry, we talk a lot about developing threat-based security programs that are architected to address broad threats on the internet, in addition to specific threats that might only target a subset of victims. The MITRE ATT&CK Framework gives you the roadmap to implement a threat-based security program. By defining techniques within tactics and loosely linking tactics to phases of the attack lifecycle, you get an information hierarchy to classify your data, while still giving you the specific indicators to identify threats.
Threat Indicators
Our detections team spends a lot of time and resources managing our threat indicators. There’s a good reason for that: We sometimes spend a lot of time investigating alerts to find attackers, so when we do, we want to make sure we can quickly identify that activity across our entire customer ecosystem. Further, we want our customers to take those indicators and implement them into their prevention technology to block further threats—for free!
What does this mean for you?
On the MDR team, we know we need to manage intelligence because the cost of detecting threats lies primarily in head count. If we have too many false positives, we’re wasting analyst time. If we ask them to detect threats using behavior analytics all the time, we’re wasting analyst time. We see this plain as day because of scale, but most security programs waste countless minutes or hours a day by not investing in threat indicator management. This adds up over weeks and months, leading to security analyst job satisfaction issues and ultimately manifesting in burnout and churn.
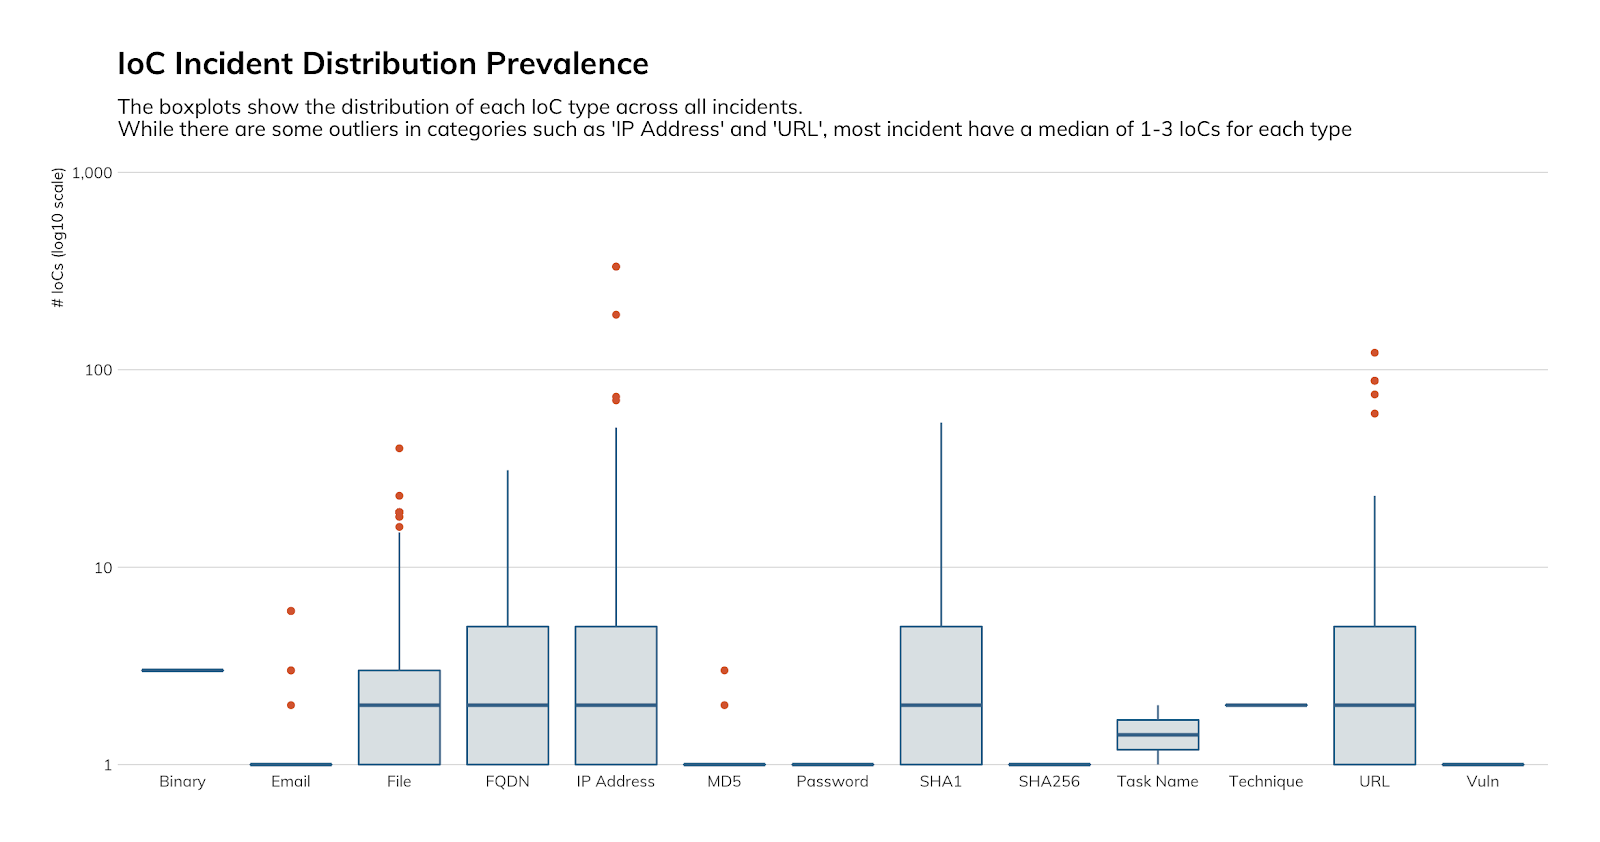
How can you use it?
Figure 15 shows the type and frequency of indicators that we report to our customers. There are a few that we need to point out: email, FQDN, IP address, MD5, SHA1, SHA256, URL, and vuln. We highlight these eight because they are the types of indicators you should be looking to collect from your threat detection and response programs. While we encourage you to share these indicators with the community, that is not why we’re highlighting them. These are the types of indicators you can feed back into your threat prevention technology to make sure that any threats with those identifiers can’t get past your perimeter defenses.
How can you improve your security program?
Threat indicator management is all about efficiency. When you track how threat indicators move from the response phase, to the detection phase, to the prevention phase, you’re tracking how much money you’re saving, how much efficiency you’re introducing, and how much risk reduction you’re implementing. We certainly not only recommend that you implement the processes described in this section, but also diligently measure the movement of indicators through your security program layers. Finally, please consider sharing with the community. We’re all in this together, and when we horde data, the attackers win.
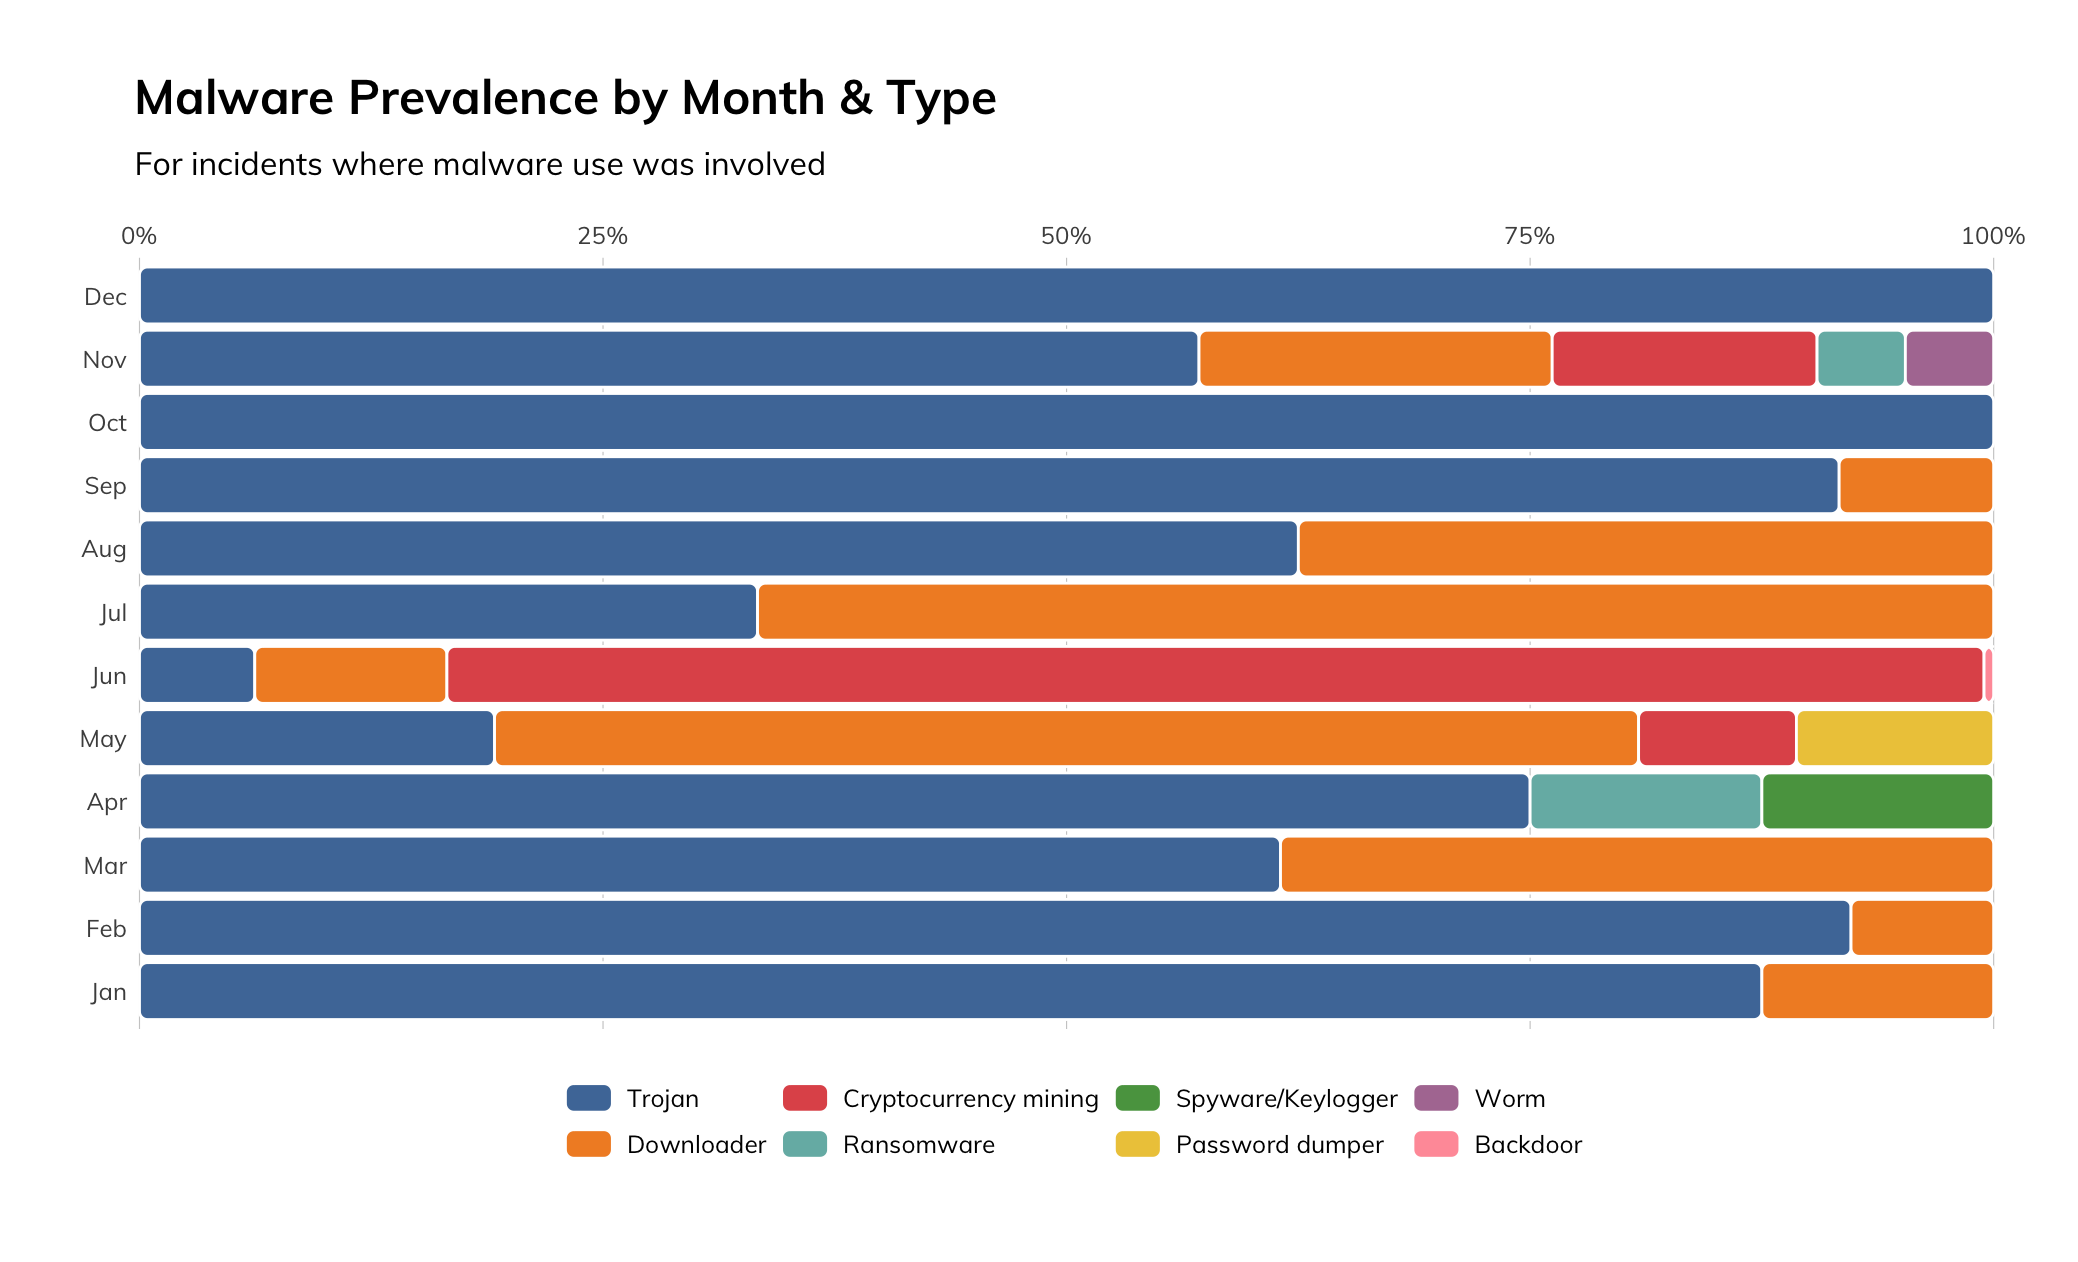
Malware Types
We see a lot of malware. That in and of itself is not surprising. What does surprise us is the overwhelming prevalence of “Trojan” in the graphic. We haven’t come up with a hypothesis as to why, nor do we understand why there is a v-shape that develops right in the middle of the timeline and extends up and down, almost as a reflection from the center. That being said, we also see a hefty amount of orange in the graphic indicating a multi-stage attack.
What does this mean for you?
Malware is a reality for all security programs; common threats use malware, targeted threats use malware, and insider threats use malware. Malware comes from different places, including: email, web browsing, malicious user installation, side-saddled with legitimate software, and uploaded through vulnerable web applications. Some malware even downloads additional malware. The only way to tackle this challenge is by balancing layers of prevention technology, detections expertise, and user education.
How can you use it?
By acknowledging that one size does not fit all when it comes to dealing with malware, we can begin to evaluate the various attack paths that we know attackers take (because we’ve adopted the MITRE ATT&CK Enterprise Framework) and establish whether controls or technology exists to help mitigate the threat of malware.
How can you improve your security program?
Let’s take email as an example attack path. We know that an attacker sends an email, we know that our mail server receives the email, we know the email gets downloaded to the client, and we know it’s possible the user will open and execute the attachment. There are two choke points in the sequence of events, and more if we look at how the attachment executes.
The first choke point is when the email arrives at our mail servers. There are multiple pieces of technology that can look at the attachment (and in some cases, the execution behavior of the attachment) to determine whether this attachment is malicious. Depending on how effective you want this choke point to be at stopping threats, you might consider employing multiple different pieces of technology.
The second choke point is when the email is delivered to the client. Depending on the platform the email client is running on, you have your choice of endpoint threat prevention and detection tools that you can use to stop the threat before the user opens the attachment.
Last, but not least, we have two variables: whether the user will open the email and whether the user will open the attachment. We, at least in part, can control that variable through user education, reminders in emails (WARNING: THIS EMAIL COMES FROM AN EXTERNAL SOURCE), or other visual cues to remind the user to be vigilant.
Recommendation Priorities and Level of Effort
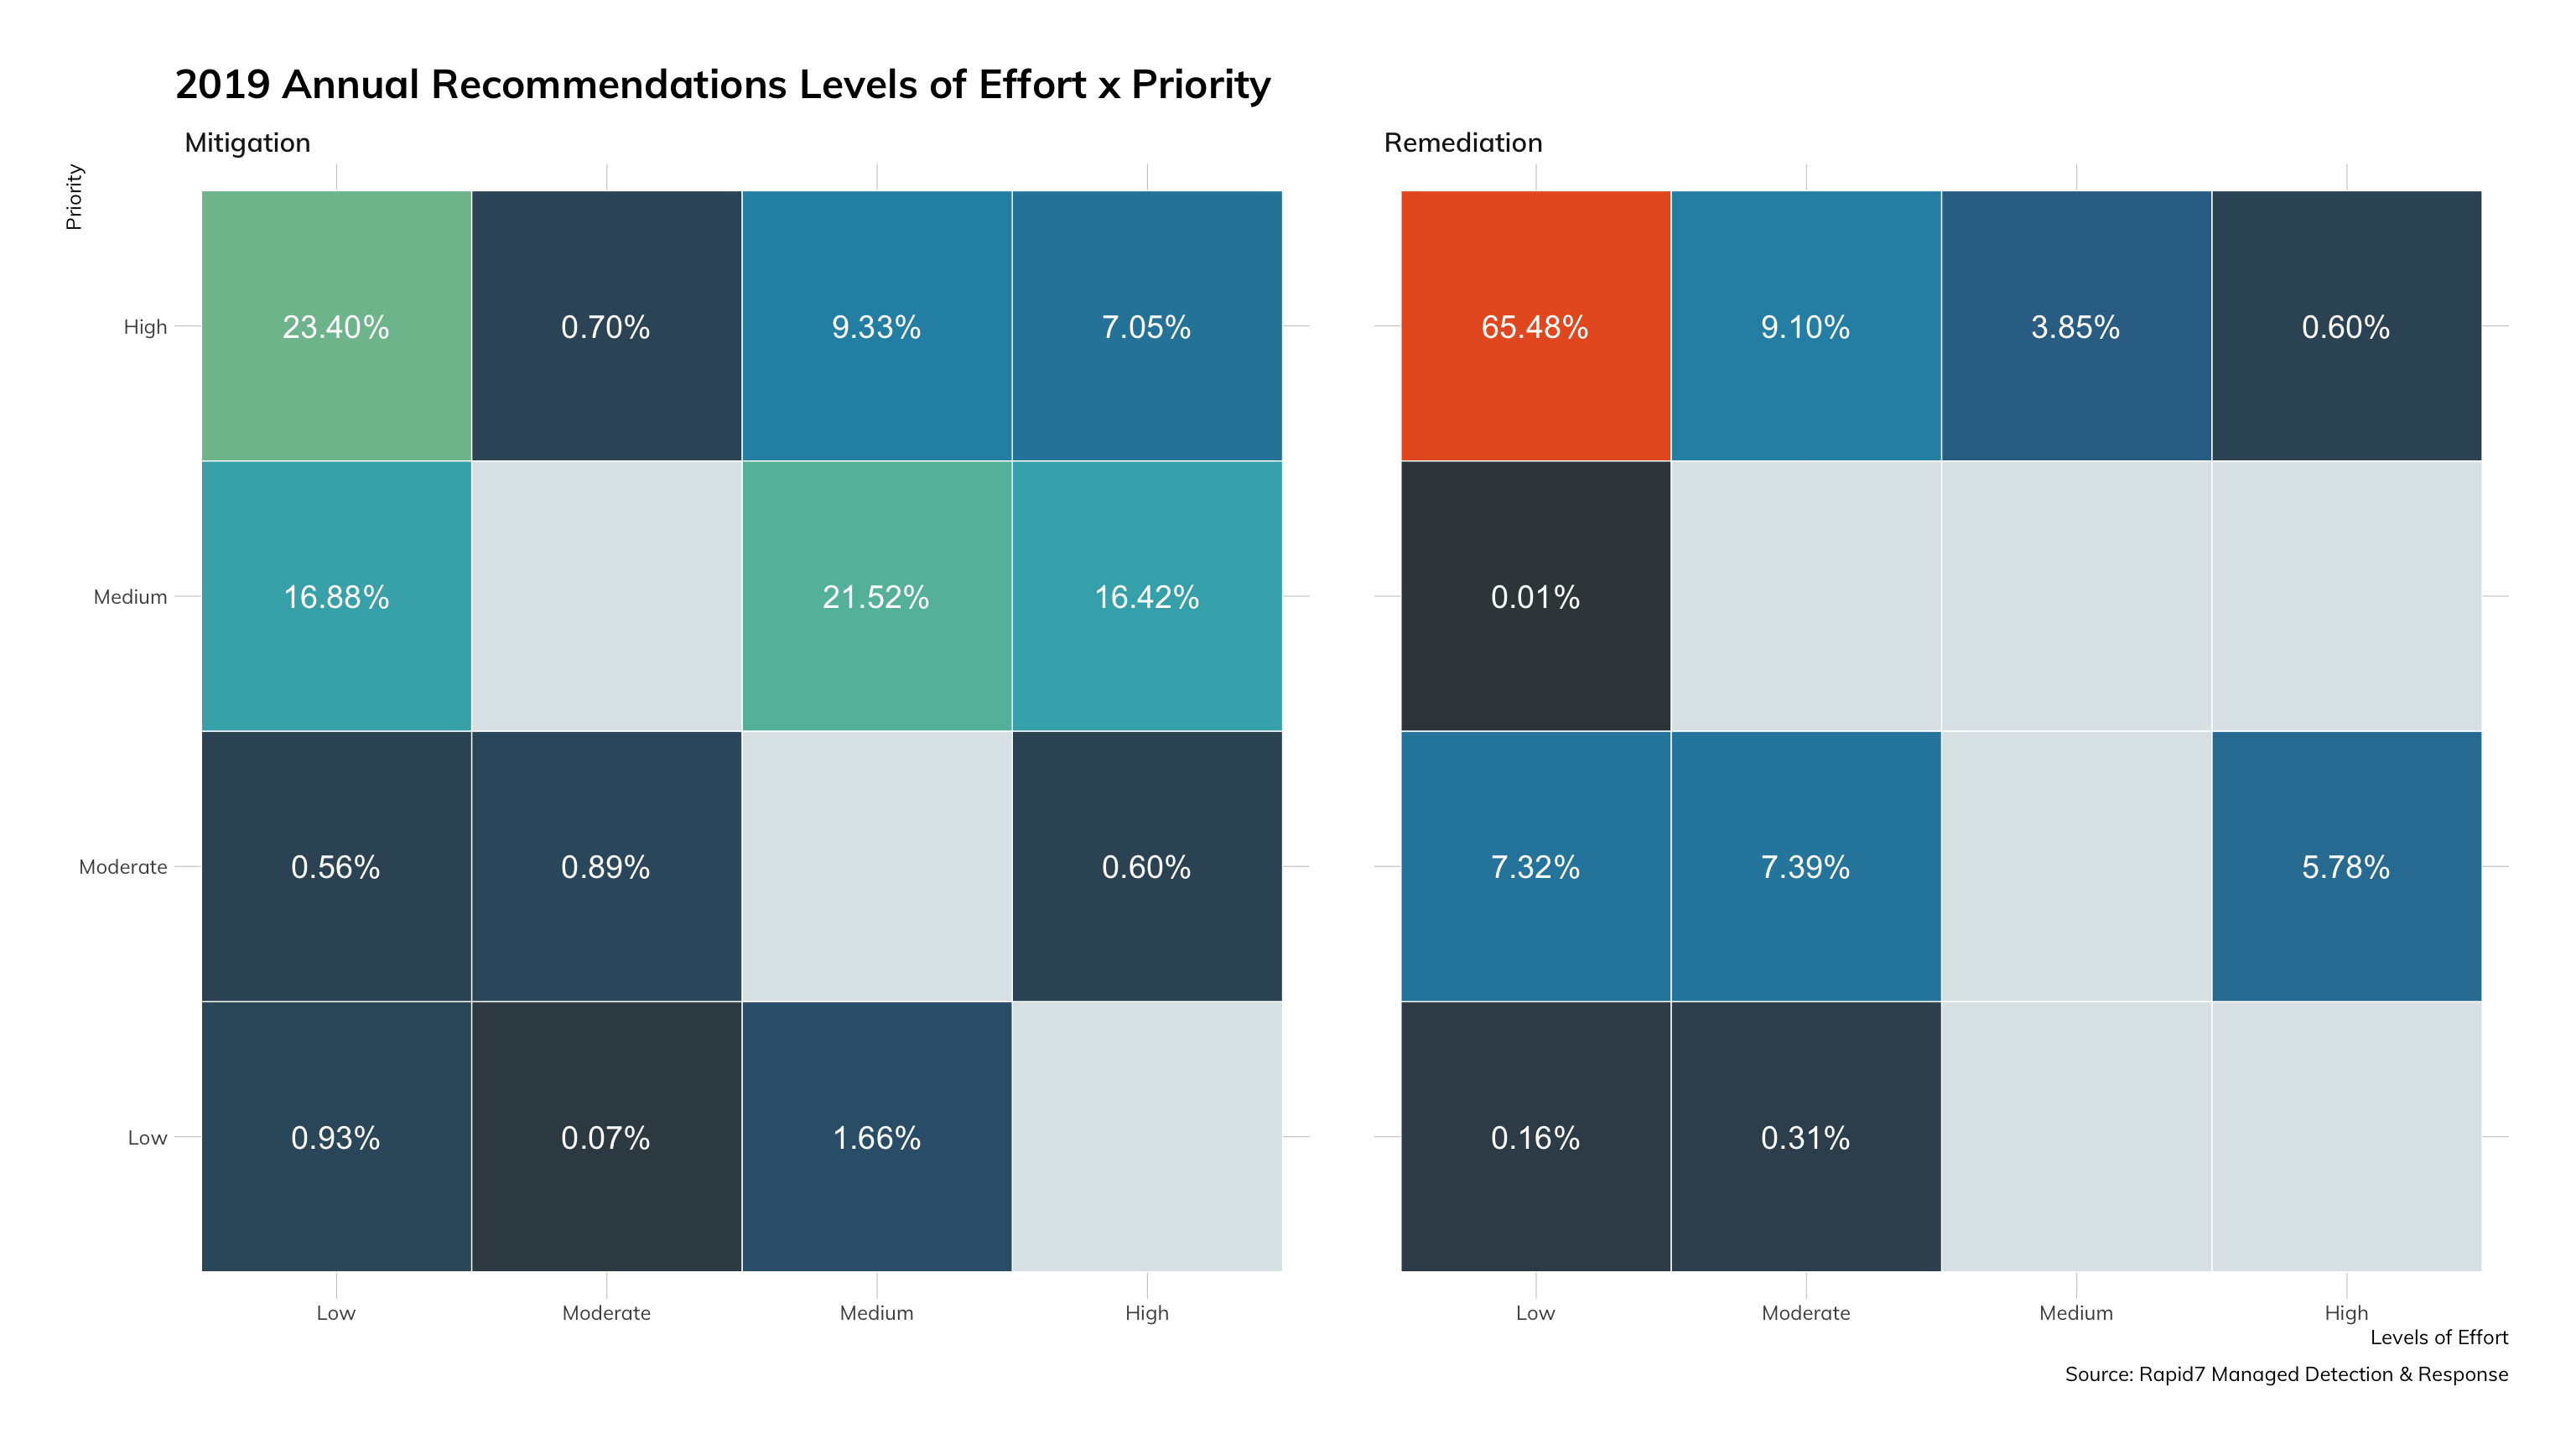
As a new feature this quarter, we’re looking at the recommendations that our MDR team includes with their findings reports. The goal is to let our customers know what we found and what they should do about it, both reactively (remediation) and proactively (mitigation). Each recommendation comes with a priority and a rough level of effort rating. A few things to note:
- 75% of remediation tasks are both high priority and only require a low-to-moderate level of effort.
- Mitigation recommendations run the gamut of priority and level of effort.
What does this mean for you?
When we see a low level of effort and a high priority, we immediately start thinking about automation. As we dive into the next section that breaks out specific recommendations, we’re sure you’ll agree. Focusing on time and costs savings for remediation activities can save a ton of money, even in the short term. Even though the level of effort is low, it still takes effort in less mature programs where humans are the ones implementing the recommendations. This data could help you augment any justification you’re already building to introduce automation into your security program.
How can you use it?
Simply realizing that 75% of the recommendations we’ve given customers to effectively remediate threats are a high priority and a low level of effort should help justify looking into (or even investing in) automation. If you haven’t considered it yet, maybe this metric will justify the consideration.
How can you improve your security program?
Automation, while already present in many security programs, is one of the next frontiers along with machine learning and artificial intelligence. The possibilities really are endless. As the model for most products in security and IT moves to the API to support security information and event management (SIEM), automation has been able to take advantage of this functionality to help security specifically, along with IT generally. From integrating different security and IT tools for seamless workflows, to automating the collection of surrounding context for alerts, to automating remediating user accounts, network access, and physical access, automation provides near limitless options for introducing more efficiency into your processes.
Detailed Recommendations
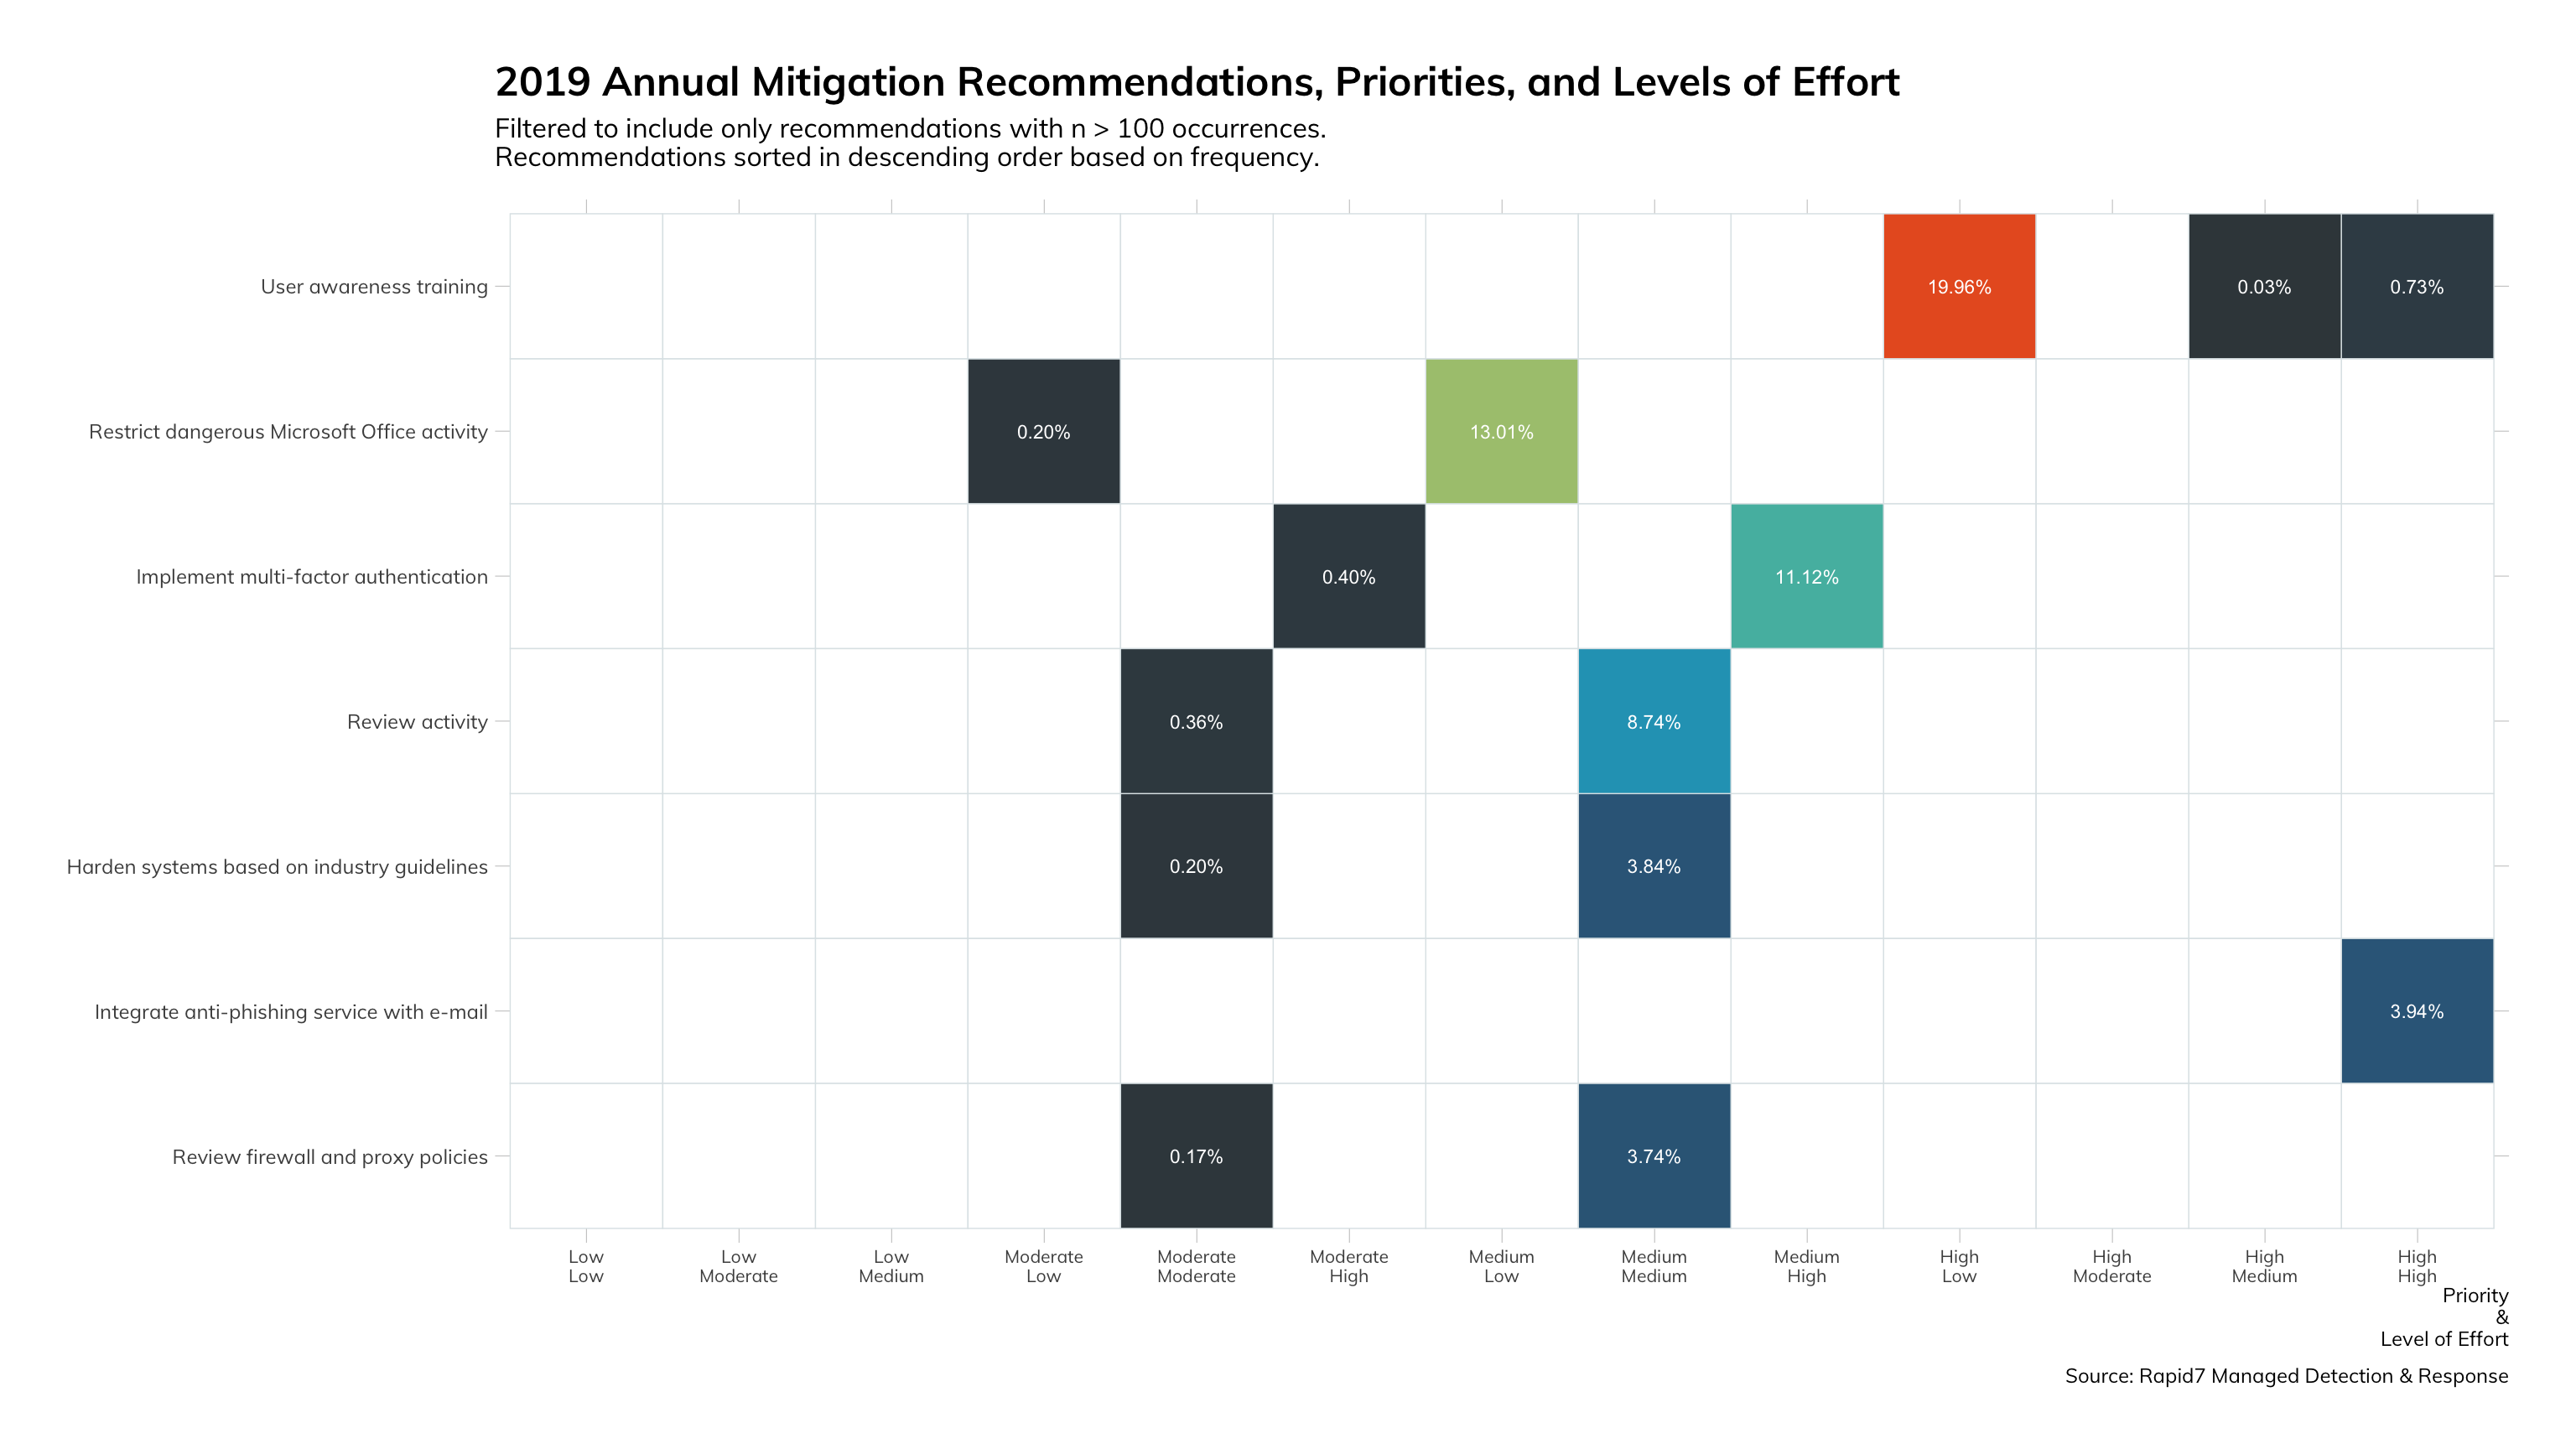
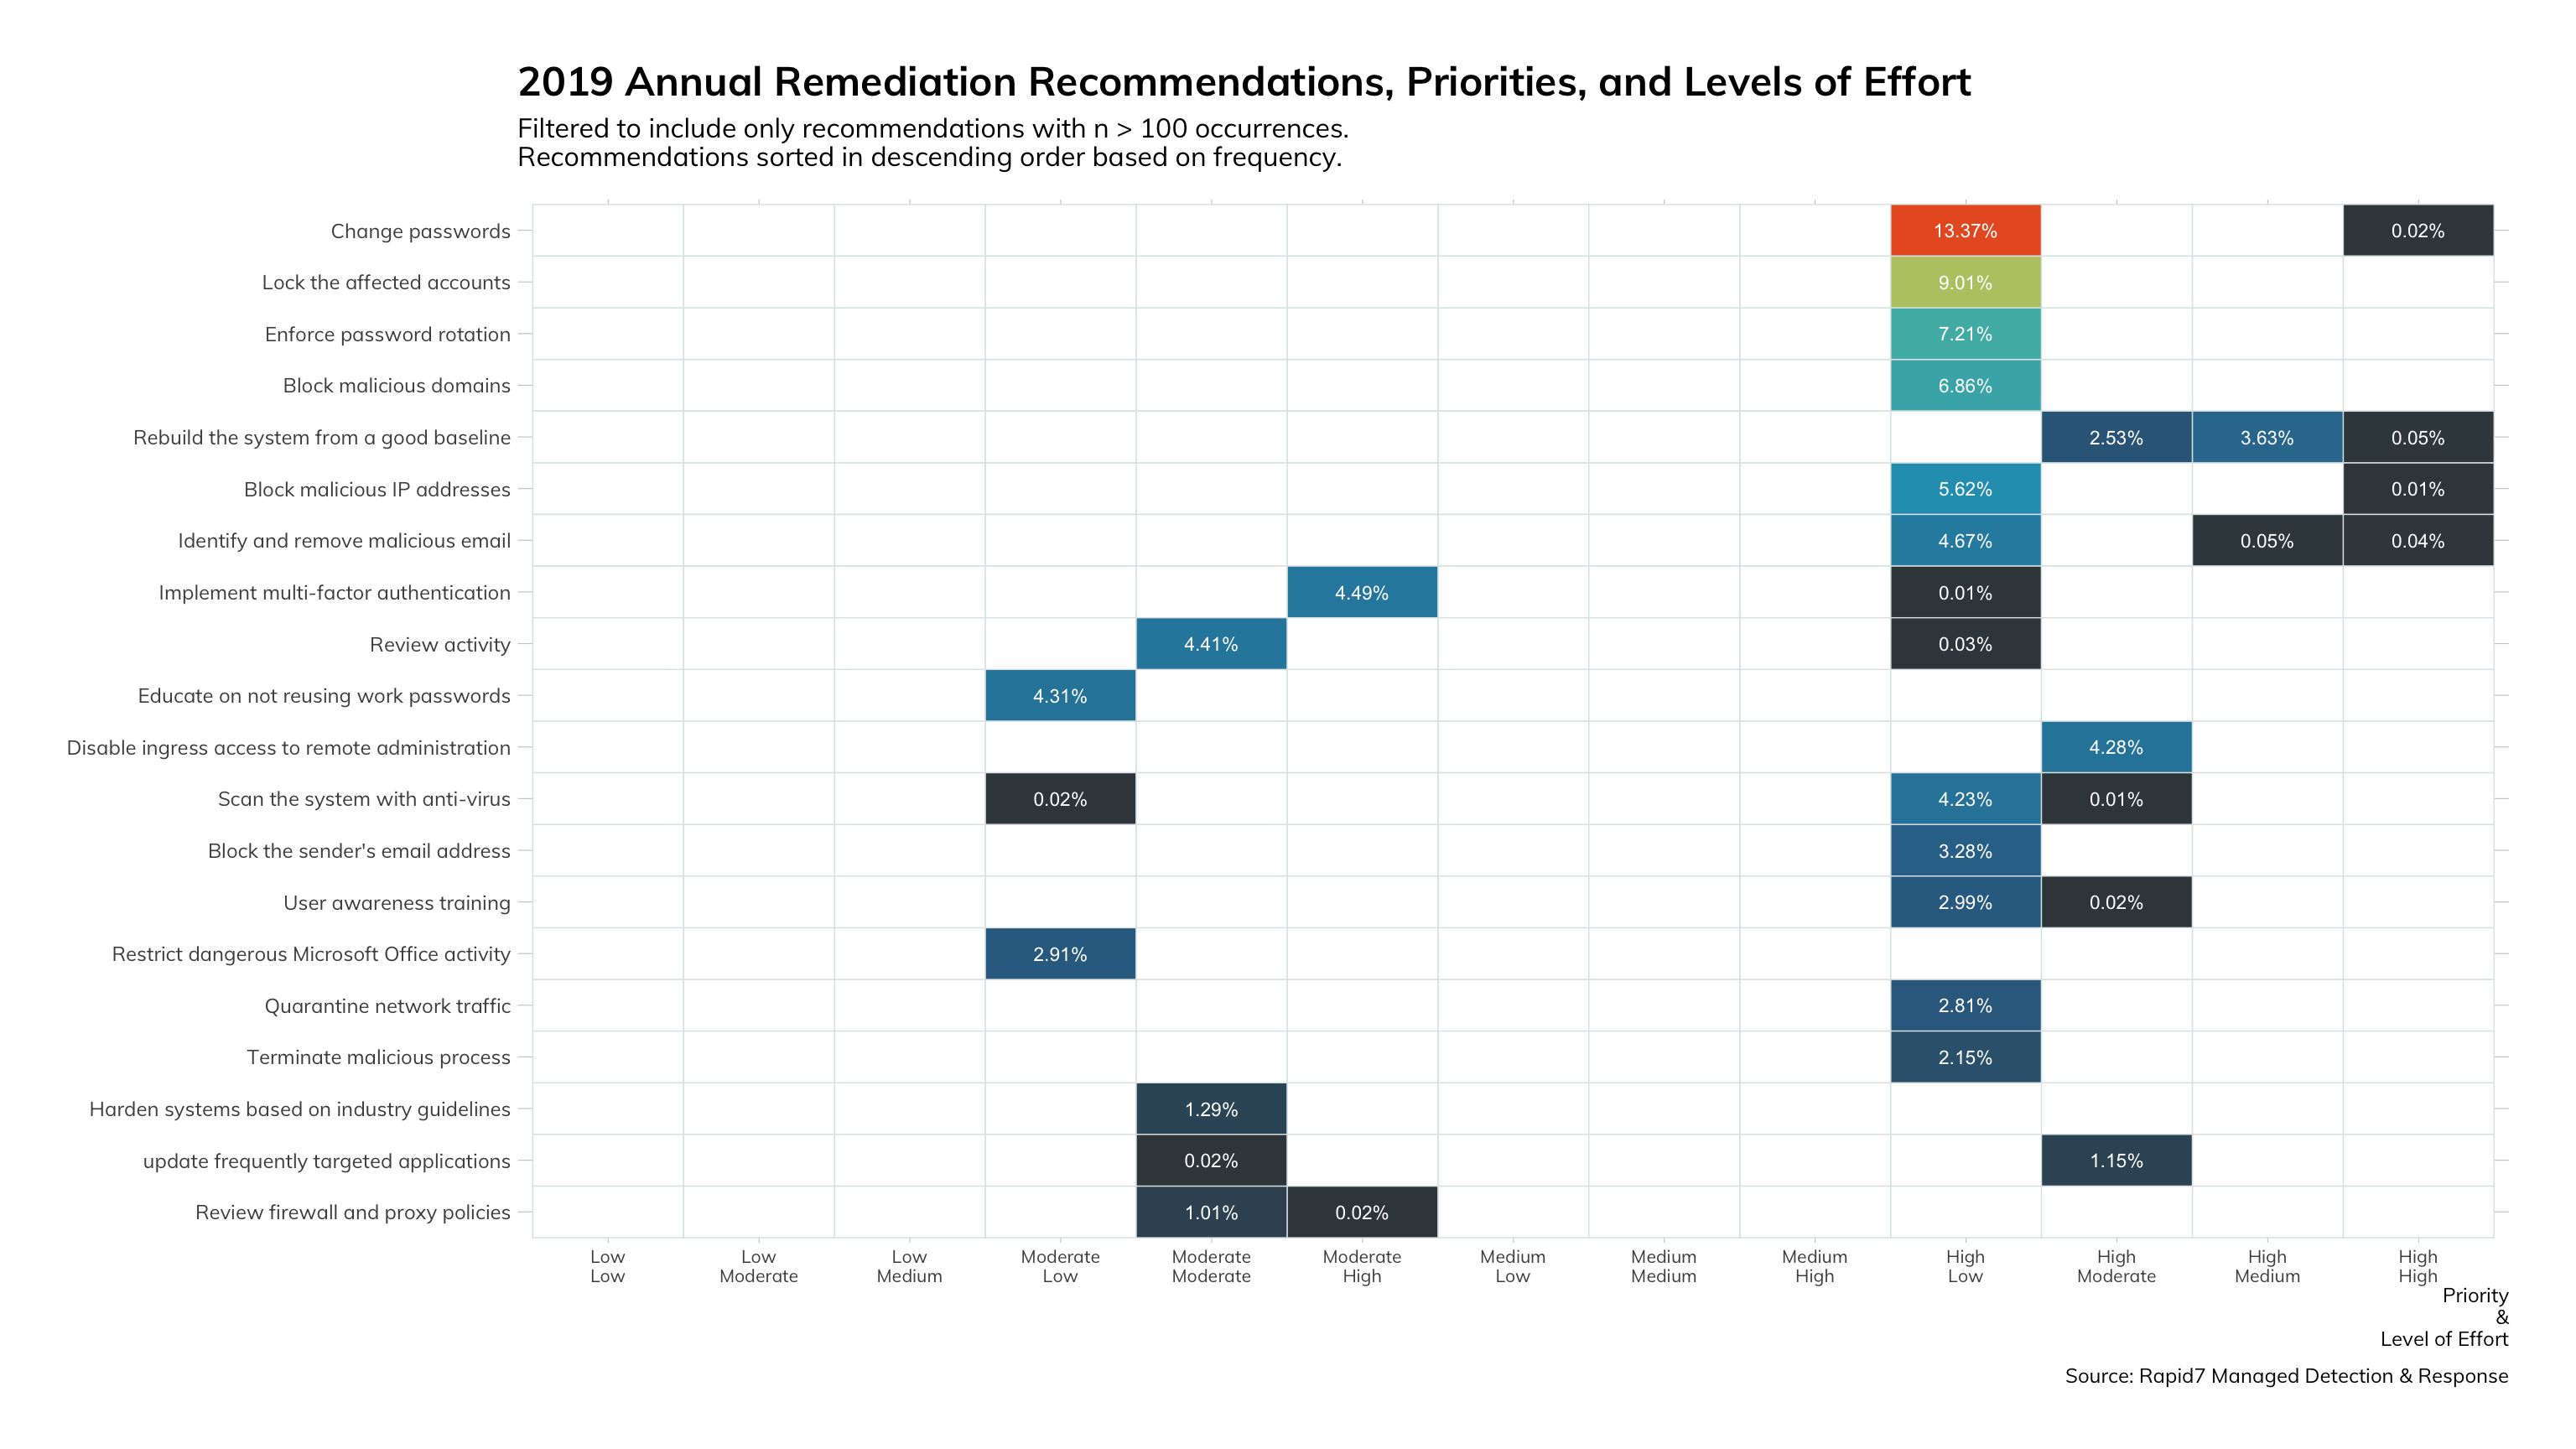
Please note that for recommendations listed in Figures 18 and 19, the first chart represents mitigation recommendations versus remediation recommendations in the second. Taking a deeper look at the recommendations data, we continue to divide between mitigation vs. remediation (reactive action vs. proactive action). We have teased out the spirit of the recommendations to highlight the simplicity of most remediation tasks.
In the mitigations data, we see a clear front runner with “user awareness training” as the most recommended action. In the remediation data, we see “change passwords” as the number one most recommended action. A point of clarification here: our MDR service and InsightIDR cloud SIEM technology are specifically architected to identify credential mis-use, so we have a little methodology bias showing here. Nonetheless, attackers need and use accounts, so account mitigations are commonplace in detection and response.
What does it mean for you?
Now that you can see the detail around the most recommended remediation recommendation, you can understand why we feel they are ideal for automation. Even if you are not tracking your own recommendation data, this data simply confirms what we already knew instinctively: there is plenty of efficiency and impact reduction to be achieved by adding automation to your security program.
Similarly with the mitigation recommendations, we all suspected (and as seen in Threat Reports like this one) that the user is most frequently the one who opens the door for an attacker. However, most organizations have a lackluster user education and outreach program. We need to use this data to focus our proactive security measures, and it clearly shows a need for greater user education.
How can you use it?
You can use wholesale to justify the investment in automation and user education. The reason we crunch all this input to provide detection and response telemetry data to our readers is to help you show executives data-driven evidence to invest in you. This data should also help confirm or refute your conceptions about what is important in security programs. Before we analyzed this data, we would have placed a higher priority on endpoint remediation. We stand corrected; turns out, user accounts are more important.
How can you improve your security program?
In the final analysis, this report points to prioritizing investment in automating user account remediation and user education as the top activities to improve pretty much any security program based on the threats that our MDR analysts have identified in our MDR customer environments.
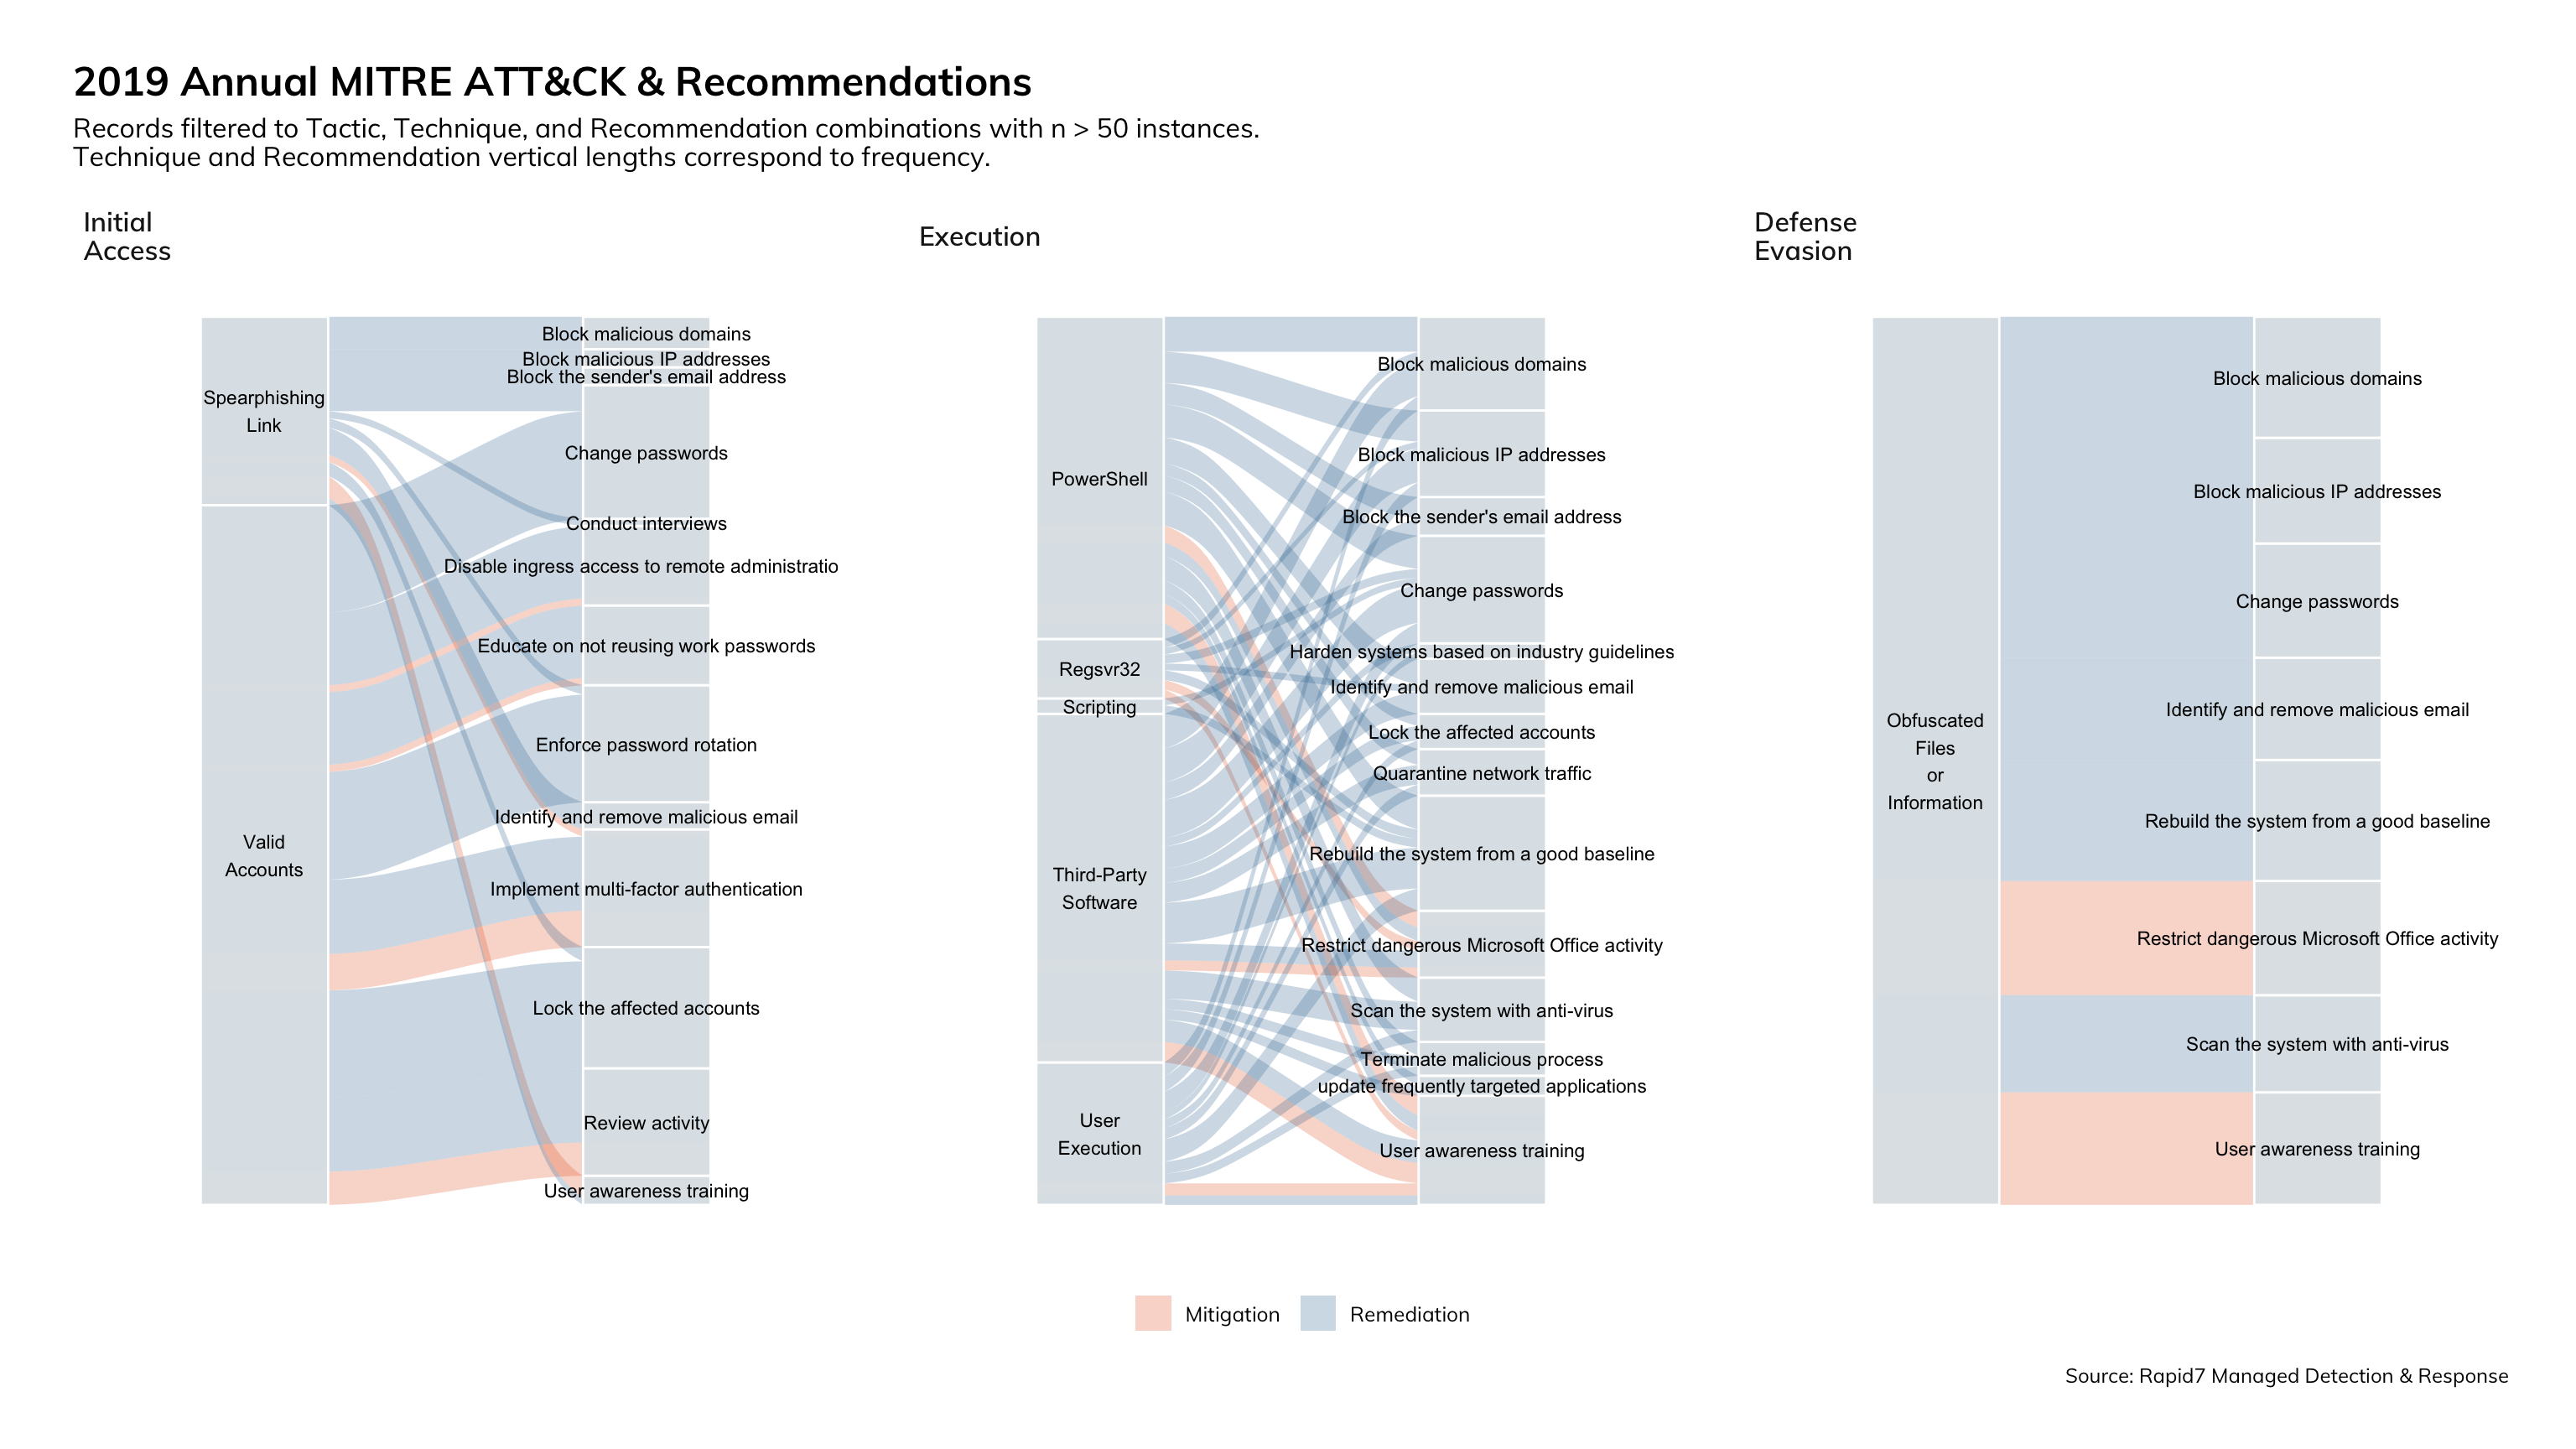
ATT&CK Tactics and Techniques Mapped to Recommendations
There is a lot of information to absorb in Figure 20. Reading each block from left to right, you’ll begin to notice patterns between MITRE ATT&CK tactics and the number of actions required to mitigate and remediate. Under the “Defense Evasion” tactic, we see that there are (relatively) few recommendations. Conversely, recommendations under the “Execution” tactic require many more steps to mitigate and remediate.
Next, we see that the color of the link between technique and recommendation favors blue (remediation). However, we do see that all but one of the techniques represented here do have some form of mitigating control to help reduce the risk. The last item to highlight is that “User awareness training” exists as a mitigating control for each of the three tactics, and in the case of “Execution” a mitigating control for each technique within.
What does this mean to you?
This data further reinforces the need to invest in automation and user education as two of the most effective ways to increase the effectiveness and efficiency of your security programs. If you are bought into using the MITRE ATT&CK Enterprise Framework as your method for creating, measuring, and reporting on your threat prevention and breach detection programs, this data, married up with your own, can prioritize which mitigating actions you should prioritize.
How can you use it?
If you are really proactive, you can take all the mitigation recommendations from Figure 20 and implement them to reduce the risk and impact of a breach. If you are just starting out in your program development, you can use this as a roadmap of capabilities you require to quickly and effectively remove a threat from your environment.
How can you improve your security programs?
Tracking your prevention, detection, and response data in the way we’ve done here gives you endless possibilities in adding other metrics. For example, a great extension to this graphic would be a time metric that measures the time between action assignment (either to a person or an automation workflow) and focusing on reducing the time for the worst offenders. Another example would be to focus on the actions that must be performed manually and evaluate whether automation is possible.
We present this new section of the Threat Report, where we’ll dive into the data collected by our user experience (UX) team when working with our customers and surveying the industry for validation.
First, you might be asking what we mean by “outcome.” In short, it’s something that someone is trying to achieve in a certain period of time as measured by some value. More specifically, each outcome is structured like this:
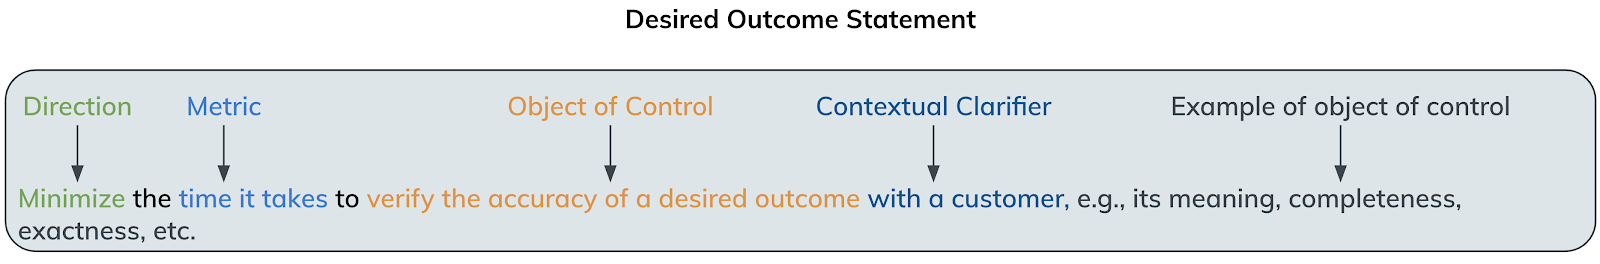
Now you might be wondering why we’re tackling this data. We believe that a component of good strategic and tactical intelligence includes knowledge of what others are doing and thinking to mount their defenses. We are very fortunate that 18 of our customers worked with us to establish these outcomes, and we feel it our duty to analyze and report on the data.
The findings of the exercise include:
- 97 outcomes for detection and response programs, ranked by importance
- 72 outcomes for vulnerability management programs, ranked by importance
To start, we looked at the top three desired outcomes for detection and response (D&R):
Outcome 1: “Minimize the likelihood that there are threats your security tools can’t detect”
- We are not at all surprised to see this as #1. This is the thing that keeps responders and business leaders awake at night. But it doesn’t have to be that way. Sure, you will always have that nag in the back of your head, but you’ll be more confident when your security program and its associated goals are maximized to protect what your business cares about the most. Remember, it’s not about preventing a breach: it’s about stopping a breach before it can cause material damage to your organization.
Outcome 2: “Maximize your ability to know what vulnerabilities are on your network”
- We typically bucket all attack surface management activities within the prevention layer of your security program. An effective vulnerability management and remediation program is a key pillar in reducing the opportunity for threats to materialize.
Outcome 3: “Increase employee awareness of security best practices to prevent issues from happening in the first place”
- We REALLY love seeing this one at #3. We firmly believe that a lack of understanding of how threats and attacks materialize in organizations leads to lop-sided investments in security programs, resulting in a false sense of security. This certainly starts with the end user, but also extends throughout the organization, including IT and security teams.
Then we looked at the top three for vulnerability management (VM):
Outcome 1: “Minimize the time it takes to respond to a critical situation”
- We find it particularly interesting to see a response-shaped outcome for VM. For comparison, the top outcome for D&R was around reliably detecting threats. Taking a step back and putting ourselves in the mindset of an enterprise security professional, we can surmise that VM and attack surface management programs have typically been around for longer than D&R programs. As such, much of the operating uncertainty around data collection and analysis, as well as decision making, has been figured out. This shows that VM programs may be at higher maturity overall.
Outcome 2: “Minimize the likelihood that your environment is breached.”
- Again, imagine our surprise when we found that the second most important outcome for VM is actually a D&R outcome! That being said, it makes sense and the priorities are in the right place. Everything we do in VM and attack surface management is to minimize the possibility that the environment is breached. We do that with good reason: VM and attack surface management are preventative measures. Preventative measures are best implemented with technology to minimize the amount of work needed to detect and respond to threats. D&R measures are typically very people-heavy, which nets in a higher cost to detect and respond than to prevent.
Outcome 3: “Minimize the likelihood that you are introducing new vulnerabilities into your environment”
- This is really the outcome for the entire vulnerability management program. It's a loaded outcome, especially when you consider that vulnerabilities can be introduced through vendors, user devices, interconnected networks, and any number of other avenues that are beyond our control. Just as we advocate setting a goal of minimizing the impact of threats and incidents to the business as attainable, the same is true for vulnerability management. Instead of minimizing the likelihood, the goal should be to minimize the impact of a vulnerability to the business.
We covered a lot of ground in this report. As we have throughout the document, we encourage you to adopt the MITRE ATT&CK Enterprise Framework to guide, execute, and measure your threat prevention, breach detection, and incident response programs. Prior to adopting this framework for Rapid7's MDR data, we struggled to gain an understanding of the trends we were seeing in our customer environments. The same can be true for your programs: once you have the telemetry to measure what's happening, the things you're doing that are working, the things that are working and could be better, and the things that aren't working at all, you will have the data you need to justify investments and measure return on investment. Here's the highlight reel for the report:
Threat Telemetry
- We need to focus on our external footprint. Our threat telemetry data shows no slowing of EternalBlue attacks, only a small reduction in internet accessible SMB servers and the continued presence of internet accessible servers like VNC, NetBios, and RDP.
- The most common techniques used by common threats are exploit of public-facing application, valid accounts, and brute-force. Effective mitigation and detection techniques include patching, network segmentation, and User Behavior Analytics.
Detection Telemetry
- Rapid7's MDR team detects over 75% of breaches in under an hour. So can you. Using multiple threat detection methodologies, augmenting detections and technology with skilled people, and giving them the tools they need—coupled with deep visibility at the endpoint and in the logs—is our recipe.
- Almost 80% of breaches detected by Rapid7's MDR service are malware-related, phishing-related, or malicious documents. While you can prevent some threats with prevention technology, the rest require a diligent threat detection team armed with visibility and tools.
- The top three techniques used by attackers targeting Rapid7's MDR clients include the use of valid accounts for initial access, the use of third-party software for execution, and PowerShell for execution. Investing in UBA and endpoint visibility allows you to detect these threats.
- Focusing on detecting threats earlier in the initial access and execution tactics of the attack lifecycle reduces the cost and impact of breaches.
- Investing in collecting and reusing threat indicators improves security program efficiency. When security programs focus on collecting indicators of compromise from breach detection and incident response activities to implement in threat prevention technology, they block future attempts right at the perimeter.
- Malware is everywhere. All flavors, types, and capabilities. The only way to tackle the onslaught is to deploy multiple pieces of technology along attack vectors, coupled with experienced defenders, increased end user security training, and automation to speed containment and eradication.
Remediation at Scale
- 75% of the remediation tasks performed by MDR customers were low level of effort and high impact. These tasks are ripe for automation that will not only speed the time to containment, but also improve the efficiency of your people.
- Proactively deploying mitigating controls based on trends in the threat landscape can reduce the risk of a breach. Rapid7's MDR findings reports include reactive (remediation) recommendation and proactive (mitigation) recommendations. Our analysis highlights the most-recommended actions based on threats identified in 2019.
- Outcomes sought by vulnerability management and detection and response programs lean and feed off each other. In the top 3 outcomes for VM and D&R, at least one outcome for each reflected an outcome in the other. Building these programs in silos results in poor performance against the stated outcomes.
Rapid7 (Nasdaq: RPD) is advancing security with visibility, analytics, and automation delivered through our Insight cloud. Our solutions simplify the complex, allowing security teams to work more effectively with IT and development to reduce vulnerabilities, monitor for malicious behavior, investigate and shut down attacks, and automate routine tasks. Customers around the globe rely on Rapid7 technology, services, and research to improve security outcomes and securely advance their organizations. For more information, or to get involved in our threat research, visit www.rapid7.com.