Pentester Pete here again. It's nice to see ya'll and thanks for coming back. Have you ever had those times when you're developing, updating, or when a Metasploit module throws a backtrace on ya, and you're scratching your head asking yourself, “why me, what's going on”? Well, I hope this blog will get you through those moments with as little pain as possible. That's right, in this blog we'll cry, laugh, and dance our way through debugging Metasploit modules.
Disclaimer: As a best practice you should never make changes to your master branch, it's dangerous. Instead create a different branch for any additions or modifications. See the Metasploit Development Environment Guide for more information. ( https://github.com/rapid7/metasploit-framework/wiki/Setting-Up-a-Metasploit-Deve lopment-Environment)
First things first, we'll need to setup our environment. All the mystical debugging magic happens with a really lobster gem called pry-debugger. What is pry-debugger? Well, pry-debugger “Adds step, next, finish, and continue commands along with breakpoints to Pry using debugger.” At this point you may be asking your self, what is Pry? “Pry is a powerful alternative to the standard IRB shell for Ruby. It features syntax highlighting, a flexible plugin architecture, runtime invocation and source and documentation browsing." (https://pry.github.com/). There aren't enough electrons available to convey the awesomeness of pry.
Why do I think pry-debugger is so jiffy cool? You get the power of Pry with the added benefits of having a debugger. The ability to step though the code and see what's happening gives me invaluable insight when trying to figure out why #{fill_in_the_blank} is not working.
How do I get pry-debugger installed? I'm glad you asked. You can use the gem command as follows: “gem install pry-debugger.” This command will install pry-debugger and any of the gems dependences. Now that we have the gem installed we can get to the nitty-gritty.
Edit the Gemfile file at the root of your Metasploit directory. Add the following line “gem “pry-debugger.”
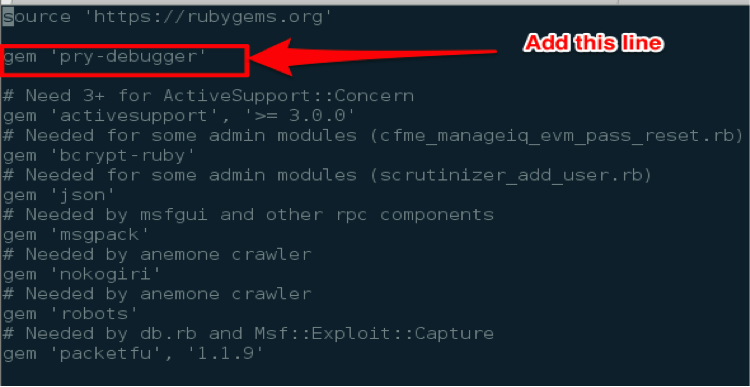
Now run bundle. This will rebuild the gem dependencies and include the pry-debugger gem. Voila, you will not need to add a “require pry-debugger” to each file you work with.
One thing to note: If you pull from the Metasploit framework repository and there is a change to Gemfile, you will have to re-add gem “pry-debugger” and rerun bundle.
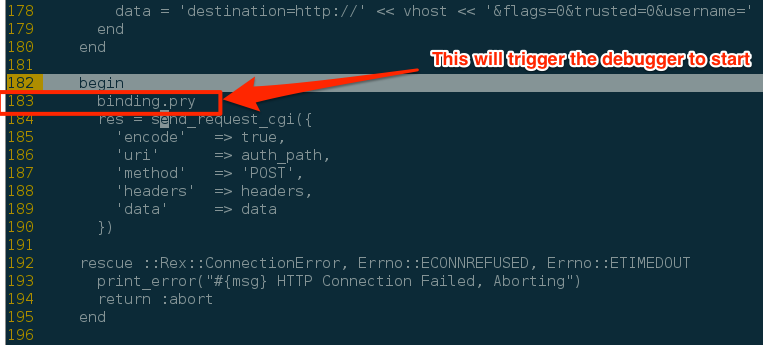
Now let the fun begin! Lets pick a module to debug. For our example today I'll use the owa_login module. This module is found under the modules/auxiliary/scanner/http/ directory. Let's say, for some reason an account that should work is failing and we want to see why. Let's crack open our favorite editor and look for the function that returns the response to our authentication request. We'll looky-looky wookie, here on line 183 we see a call to send_request_cgi.

This is where we want to start debugging. To enable the debugger we add the line “binding.pry” right before the call as shown in the following example.
Now we save the module and fire up our always-trusty mfsconsole. If you are already in msfconsole and used the edit command to edit the file, you can save the file and type reload to refresh the module. All righty, simple enough; now let's start debugging!
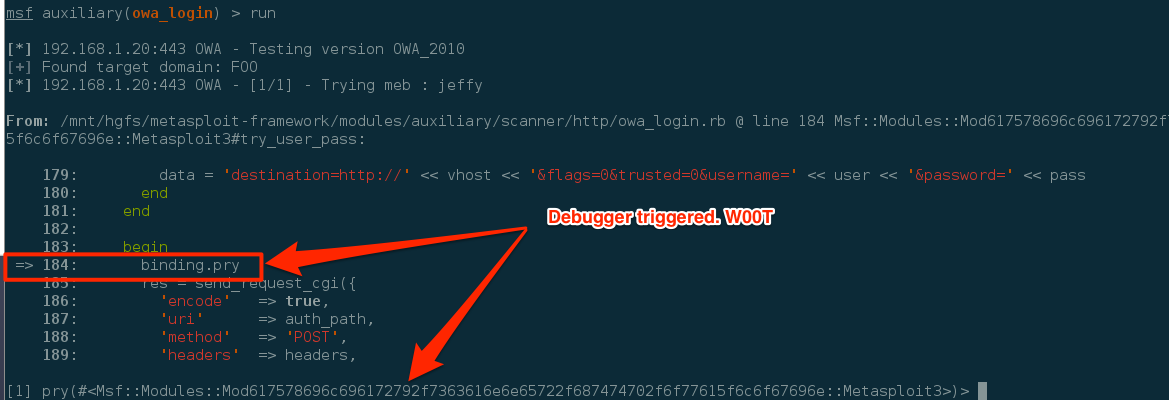
Configure the modules' options and run it. Once the module reaches line 183, it will trigger the pry debugging statement. You should see the following screen indicating that the debugger had been triggered.
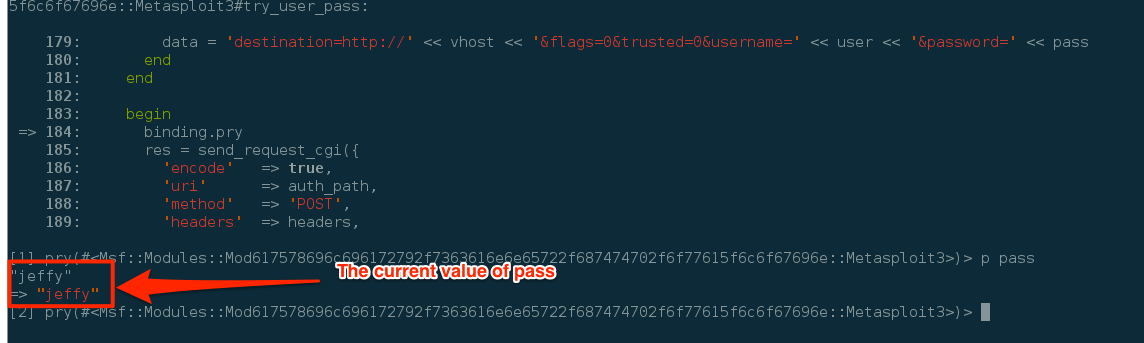
Now that we are in “debug mode” we have full access to any in-scope variables, constants, and functions that the module would have. Let's see what value the pass variable is set to. You simply use the p command and the variable name. The following figure demonstrates this. As shown, the pass variable is currently set to jeffy.
RAD, so now we know how to access the value of a variable, but I want more! Ok ok, so to step into the function you can use the command “step.” This will step you into the function. W00t we are now in the send_reqeust_cgi function. Now say you want to step over a function. This can be accomplished with the next command.
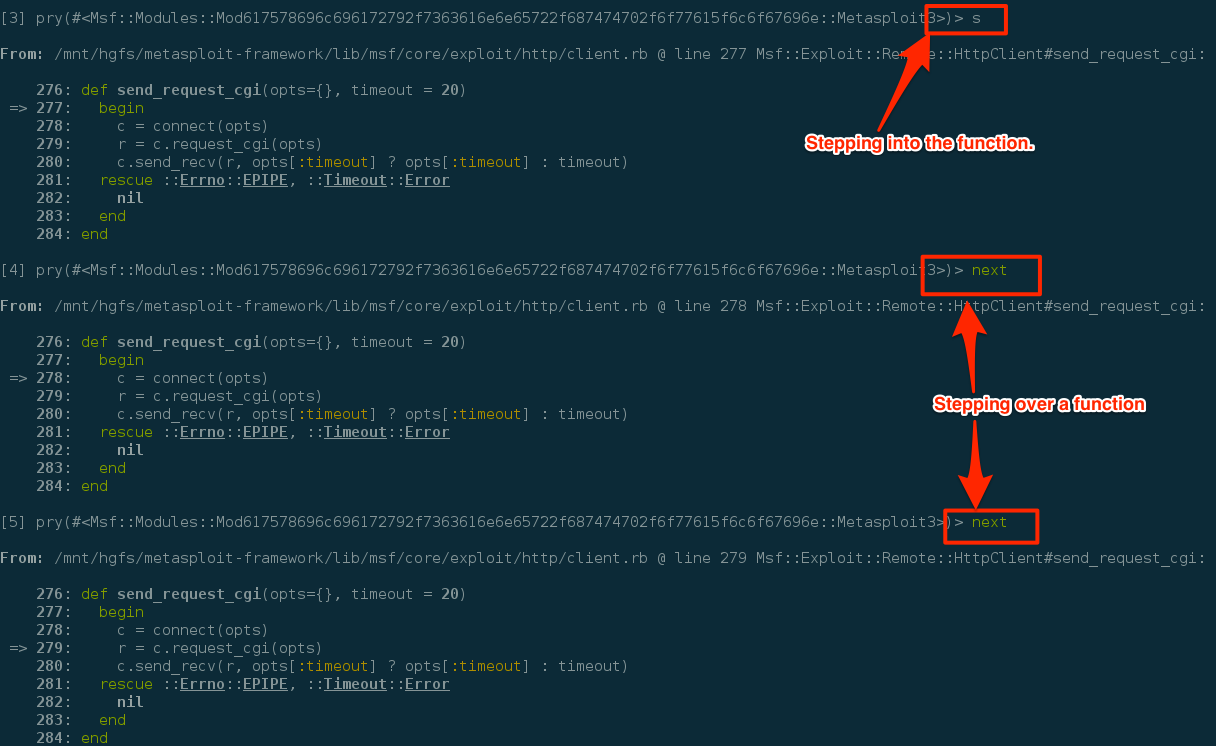
Now if you're paying attention to the screenshots, you're yelling at the screen saying, what used “s” to step. You are correct. You can setup shortcuts so you don't have the type the entire command. How to setup these shortcuts can be found here: https://github.com/nixme/pry-debugger#tips.
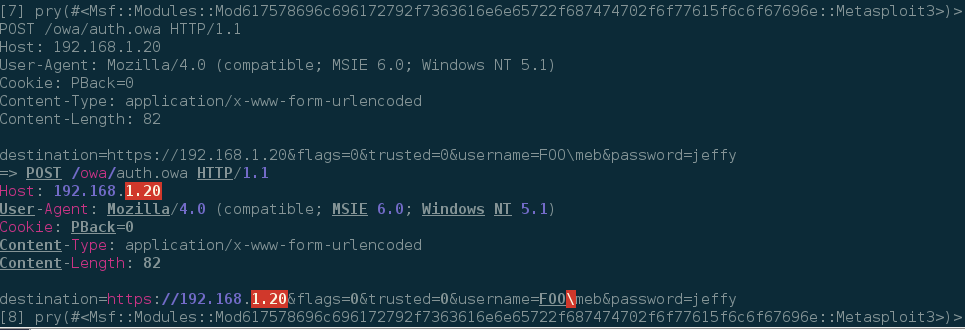
Now that we are in the send_request_cgi function. Let's see what data is contained within our request. Can anyone guess what command we would use?????? That's right the p command. To see what the request looks like we issue “p r” and boom, there's our request data.
You can use the “continue” command to continue execution of the module. The next time you're stuck trying to figure out why something is not working, don't forget about your buddy, pry-debugger.
This concludes our walk on the wild side of debugging Metasploit modules. I hope you enjoyed our brief tour. May the bits be with you.
For more information on pry-debugger see: https://github.com/nixme/pry-debugger
For more information on Pry see https://pryrepl.org/