This blog is the final piece in our four-part series on hardware hacking for the security professional and researcher. Be sure to check out the other blogs in this series:
- Part One: Extracting Firmware from Atmel Microcontrollers
- Part Two: Extracting Firmware from Nordic RF Microcontrollers
- Part Three: Extracting Firmware from Microchip PIC Microcontrollers
In our fourth and final part of this ongoing series, we will conduct further firmware extraction exercises with the Texas Instruments RF microcontroller (CC2640). To be able to gain access to the firmware on CC2640, we will access the controller using compact Join Test Action Group (cJTAG).
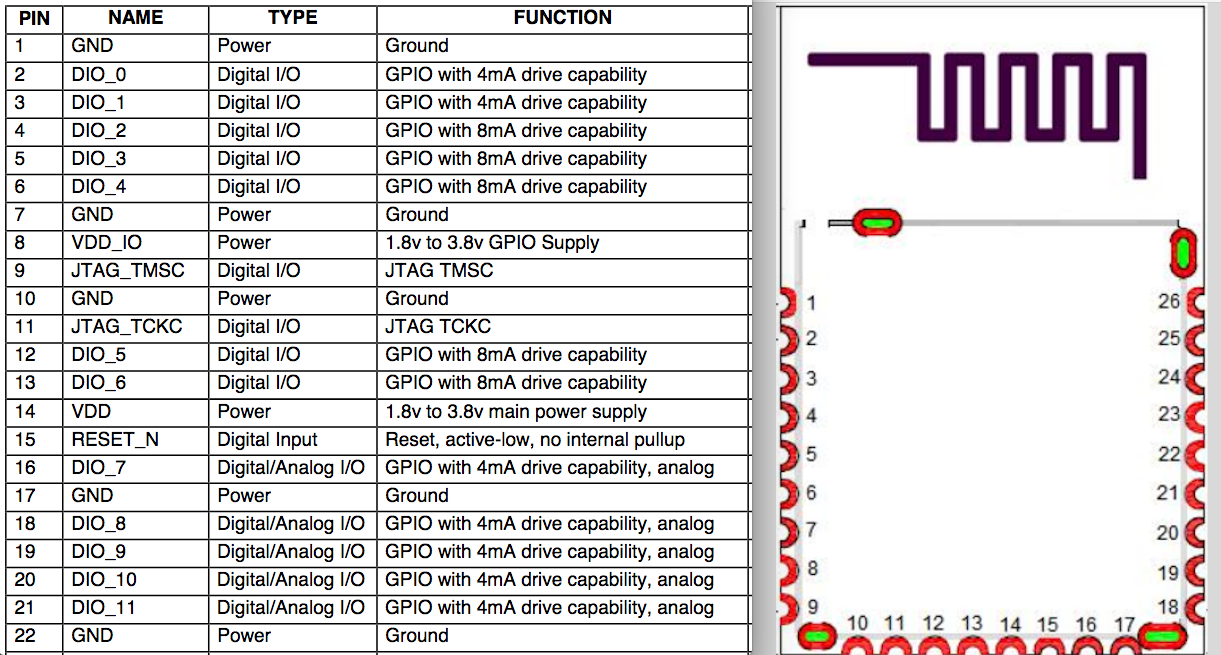
cJTAG is a subset of JTAG and utilizes only the following two pins (versus the typical four-pin connection JTAG uses):
- TMSC (Test Serial Data)
- TCKC (Test Clock)
The SimpleLink Debugger is an inexpensive, small-form-factor XDS110 debugger that supports cJTAG. It is also significantly cheaper than the full-scale XDS110 debugger.
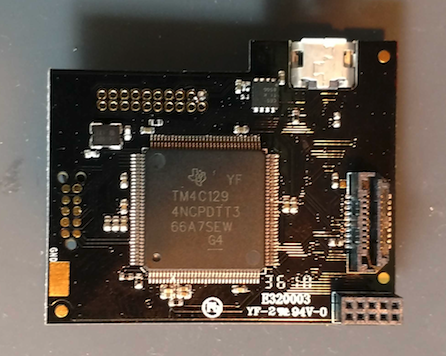
Our target device today is a CC264BPA Bluetooth Low Energy (BLE) module running the CC2640R2F:
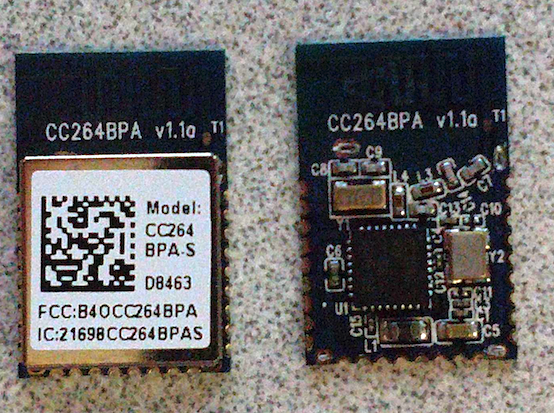
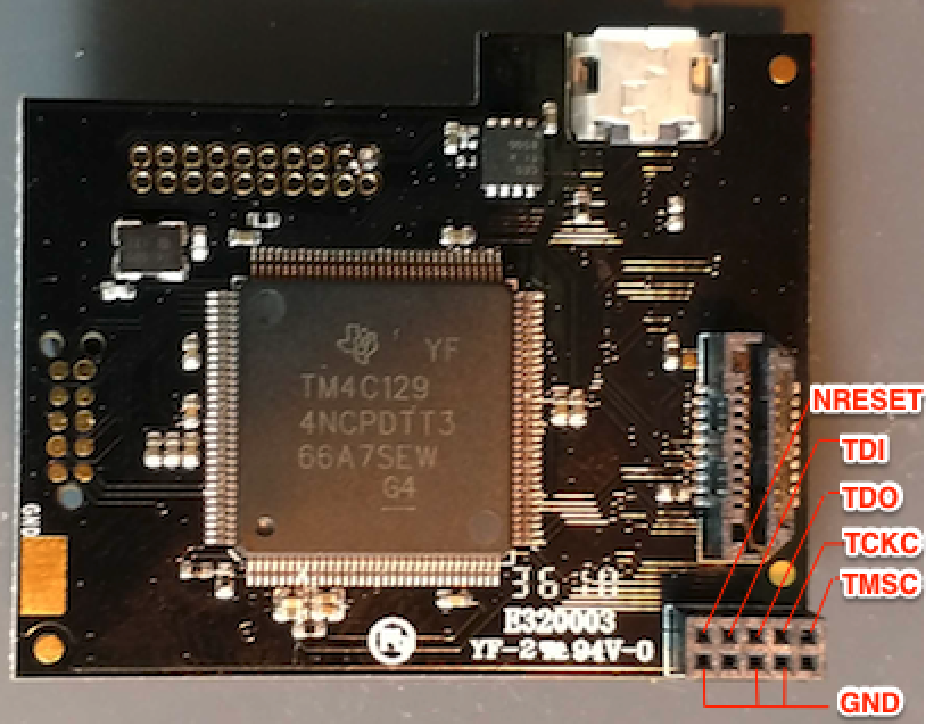
When dealing with small-footprint devices, it is very rare to find headers that allow direct access to the debug services. In those cases, you will typically need to solder directly to the chip or some other area on the circuit board’s surface. To do this, I like to use 30-gauge wire-wrap wire. With this device, we can easily attach our wires’ connections along the edge of the device. These edge connectors are designed to attach this module to the larger circuit board.
Next, we need to identify the edge connector. In the above example on the right side, I show one of the modules with its shielding case removed. If a module’s datasheet cannot be located, you may have to remove the shielding to gain access to the MCU in order to trace out the needed pins. In this case, the manufacturer of the module has made a datasheet available with the needed pinout information.
Because we are testing against a standalone BLE module, we will also need to supply the needed voltage (3.3v) and add a 10k ohm pull-up resistor to the RESET_N pin 15 and add that to pin 14. We also need to make sure we have a 3.3v power source and connect that to pin 14 and pin 8, as shown below:
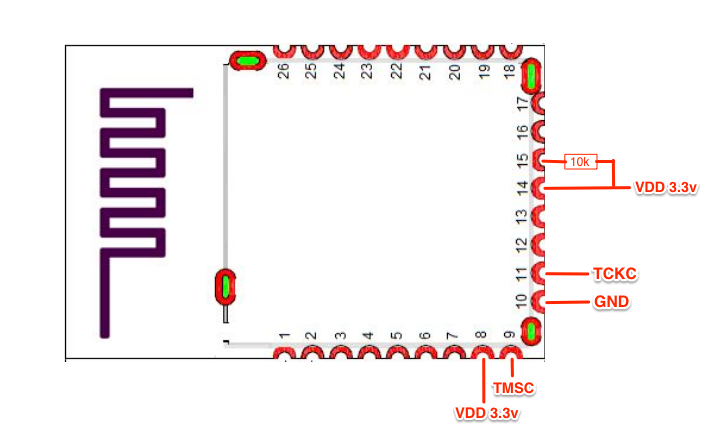
Once the pull-up resistor and all the needed connection wires are soldered on, we will connect the following to the XDS110 debugger:
- TCKC → TCKC
- TMSC → TMSC
- GND → GND
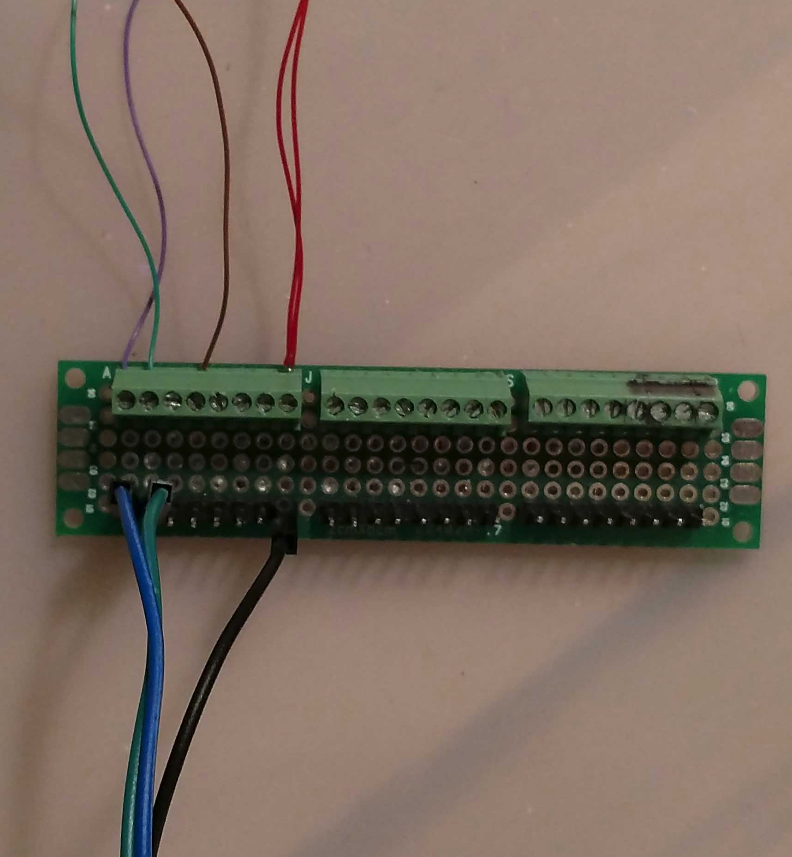
I typically use a home-built screw terminal block with 2.54mm headers to connect the small 30-gauge wire from the device being tested to a debugger:
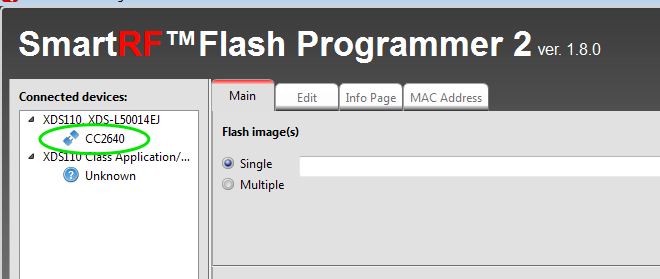
To read the MCU’s flash, you’ll need to install the SmartFlash Programmer 2 application from TI on a Windows host. Once installed, we can plug the XDS110 debugger into the USB and the application should detect the debugger and the target device’s MCU:
To extract the firmware from the device, we next select the Edit tab. From there, we can read the flash memory and save it to a file by selecting Read or Read Flash to File:
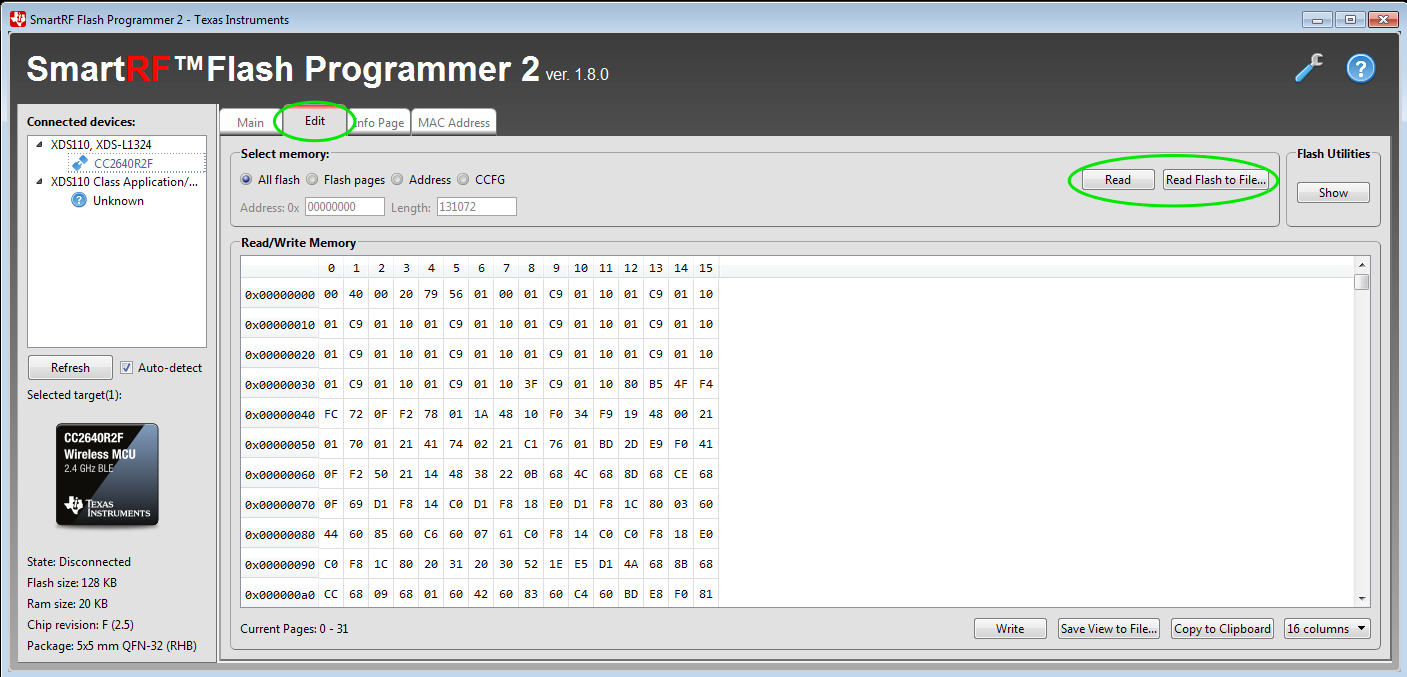
From here, we can utilize other tools and methods for evaluating the firmware extracted from the CC2640R2F MCU.
This blog concludes my mini series on reading flash memory on microcontrollers. In this series I tried to cover:
- Different debuggers
- Bus Pirate
- PICKit 3
- Segger J-Link
- XDS110
- Different debugger applications
- Avrdude
- MPLab X IDE
- Segger J-Flash
- XDS110
- Different debug services
- SPI
- ICSP
- SWD
- cJTAG
- Different issues and challenges
- Identifying pinout
- Virtual Machine USB issues
- Connecting to headers and soldering directly to circuit boards
- Converting Intel Hex to Binary
When working with hardware, you can encounter a number of unexpected challenges. For example, while working on this blog, my first XDS110 debugger kept claiming the debug service on the chip was locked, despite detecting the MCU correctly. This prevented me from reading the flash memory. I tested three different devices, all with the same results. After testing the CC264BPA device used in this blog with a Segger J-Link debugger and having it show that it was not locked, I went out and purchased a new XDS110 debugger, which is shown in this blog and worked perfectly. Apparently my first debugger had some issues. In my lab, I always try to have multiple solutions available for debugging and extracting flash so that when things go bad, like in this case, I can test with other options to validate the findings.