
We’ve been using Hystrix in production here at Logentries for over a year now [shameless plug: I briefly talked about this at a Clojure Ireland meetup recently :)] and have found it useful not only for bulkheading requests, but for getting fine-grained metrics for internal API calls.
Netflix has also open-sourced a funky dashboard to render the metrics in real-time. It’s a really well executed tool for getting instantaneous info about the state of a production system, but on its own doesn’t let you derive any long-term conclusions from the data.
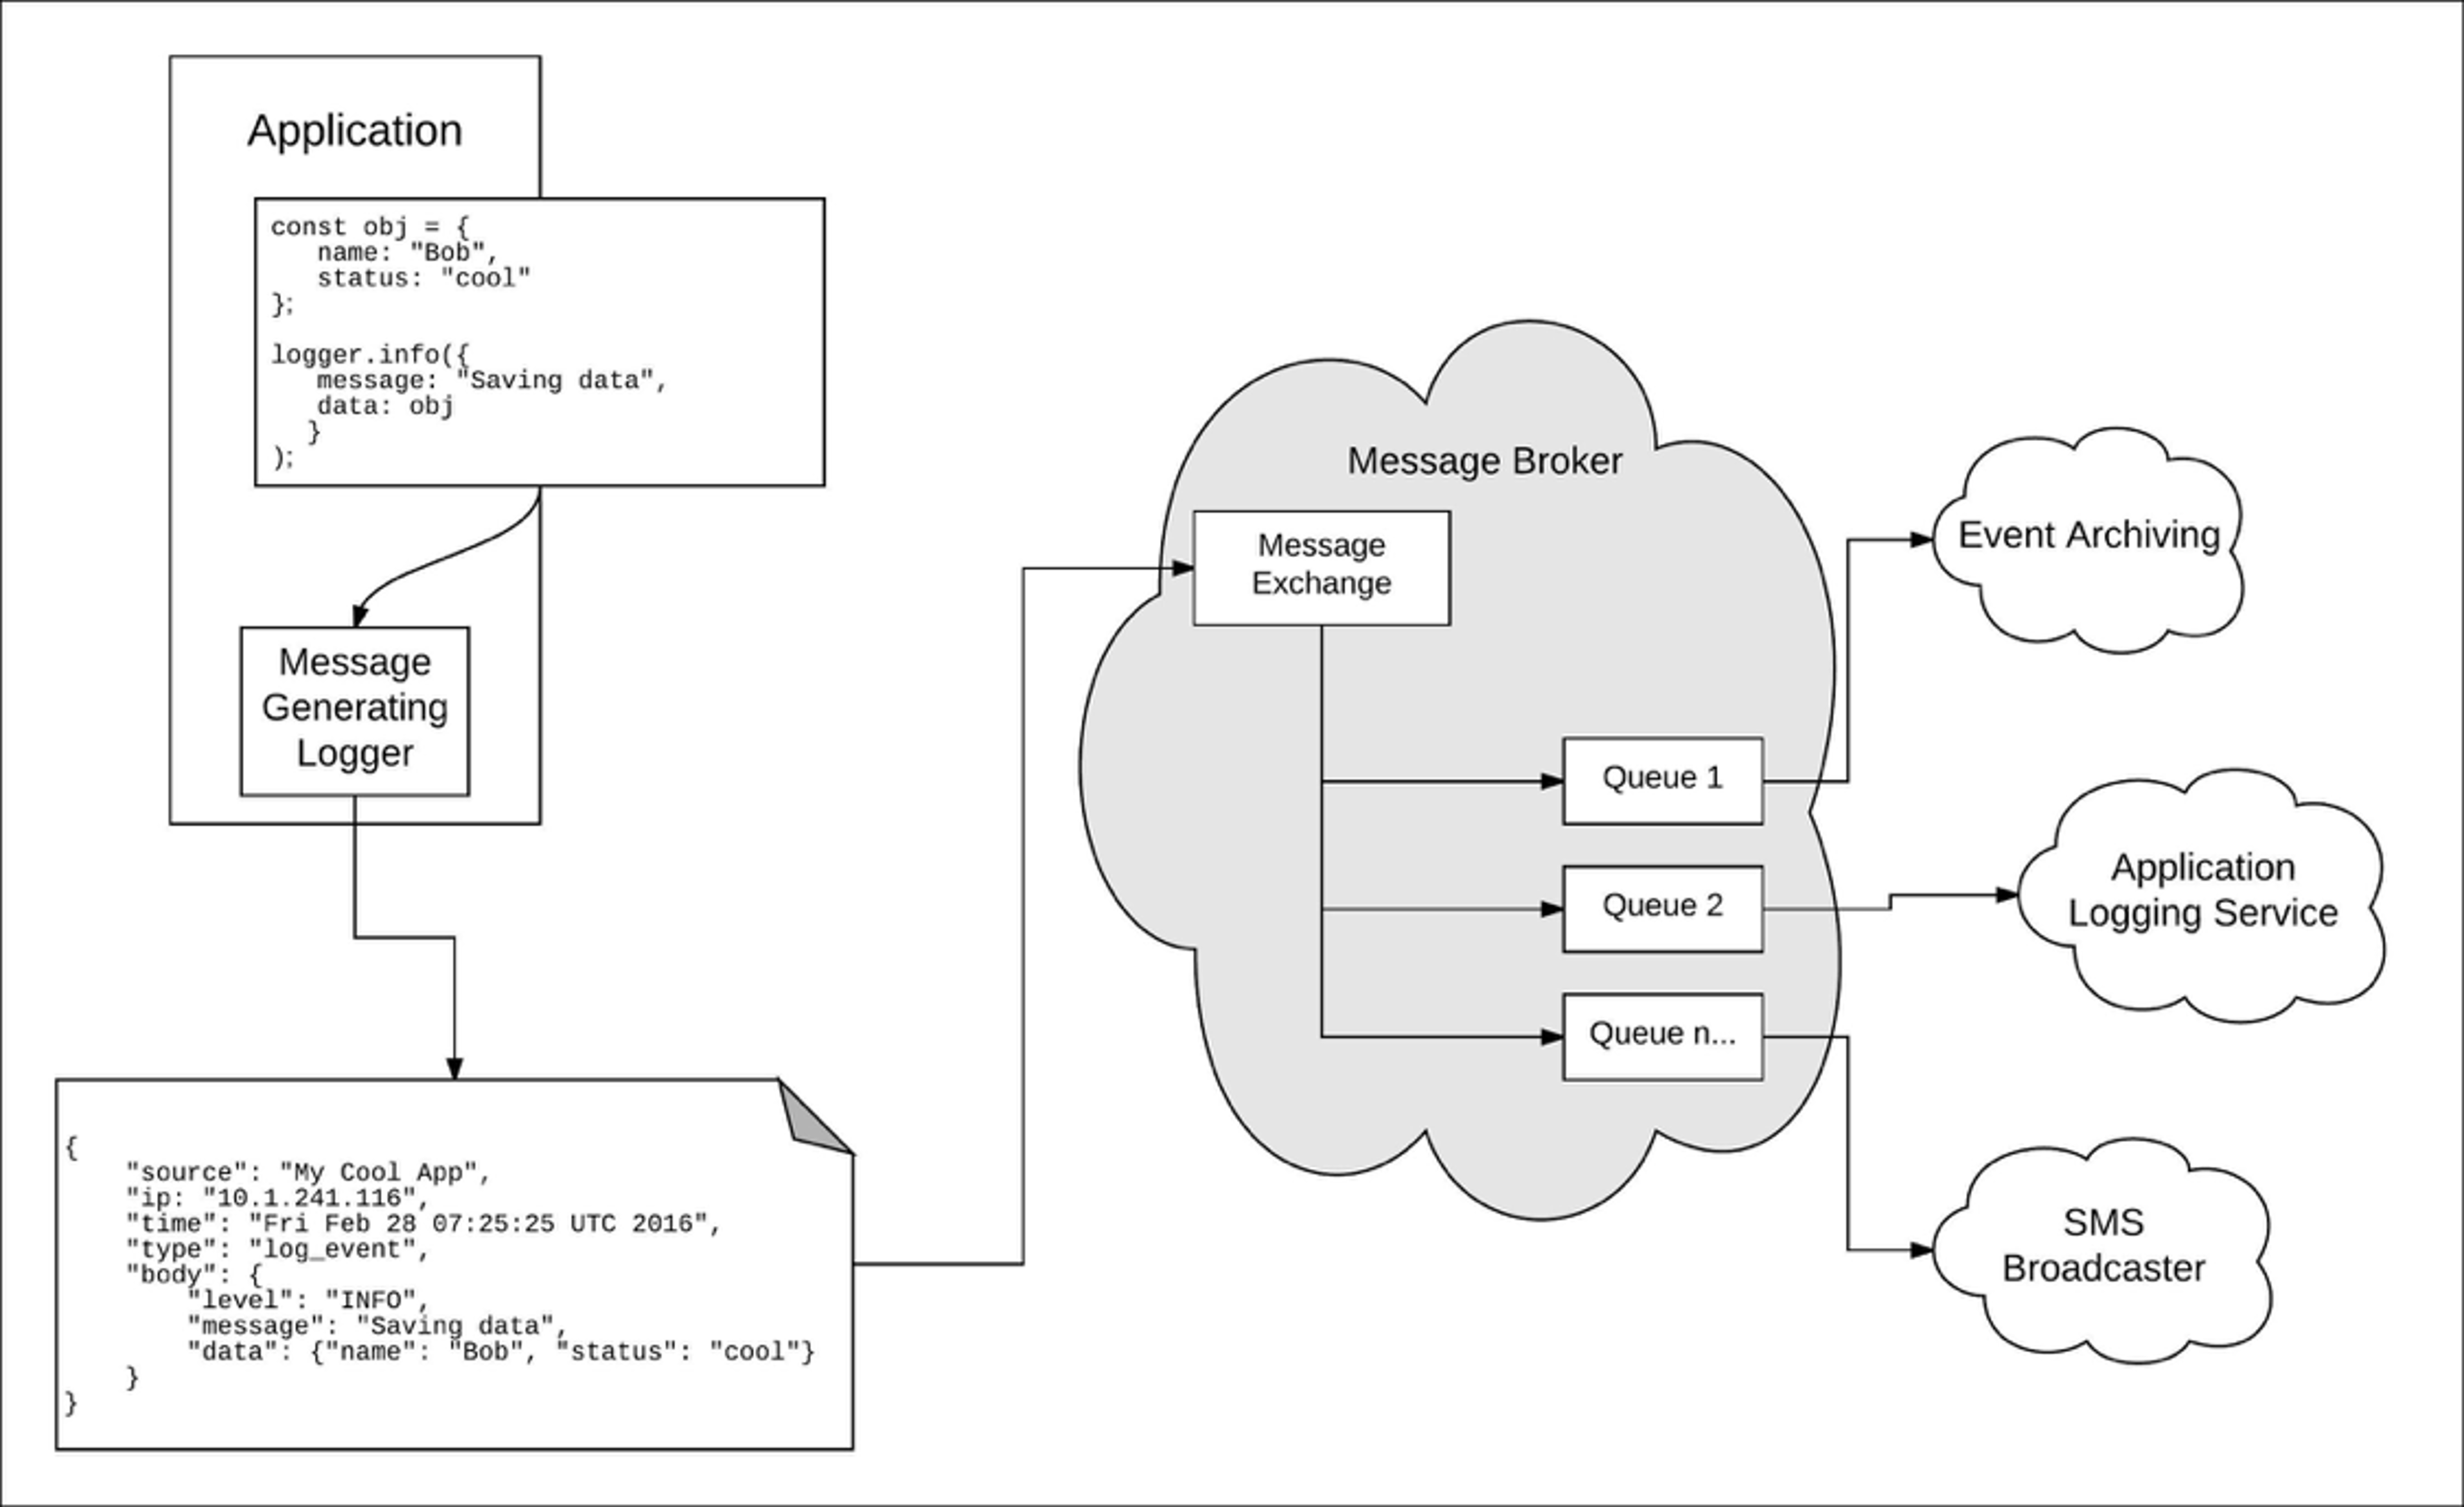
As it happens I work for a company that’s pretty good at getting insights out of data like this, so let’s see if we can pipe the Hystrix metrics into Logentries and have some fun with it. This is also a cool way of illustrating how we actually use our own product for production monitoring.
First some code; Netflix bundles a couple of reporters for Hystrix metrics that integrate with graphite and servo but a simple one which just prints the data to a log is easily implemented. I’ll do it in Clojure because:
- It’s concise
- I like it
But hopefully if you’re not interested in languages with parentheses you’ll get the general idea anyway:
(ns com.mowforth.hystrix.reporter "Hystrix reporter which echoes data to a log at a fixed interval." (:require [clojure.tools.logging :as log]) (:import [com.netflix.hystrix.contrib.metrics.eventstream HystrixMetricsPoller HystrixMetricsPoller$MetricsAsJsonPollerListener]) (:gen-class :name "com.mowforth.hystrix.reporter.LogentriesReporter" :implements [io.dropwizard.lifecycle.Managed] :init gen-poller :main false :state state)) (defn -gen-poller [] (let [frequency 5000 ; just hard-code the polling frequency to 5 seconds for brevity listener (reify HystrixMetricsPoller$MetricsAsJsonPollerListener (handleJsonMetric [this json] (log/info json)))] (HystrixMetricsPoller. listener frequency))) (defn -start [this] (.start (.state this))) (defn -stop [this] (.shutdown (.state this)))
(A fully working mavenized version is here)
It’s a naïve implementation that just prints everything it can find from Hystrix every 5 seconds, but good enough as a first pass.
We need one more bit of code to hook the reporter into our application- you’ll notice my implementation honours Dropwizard’s Managed interface so it can be dropped straight into a DW app as a one-liner:
environment.lifecycle().manage(new LogentriesReporter());
We’re done coding now; assuming you’re already sending us logs (there’s plenty of documentation to get you started, by the way) then let’s hit our newly-minted Hystrix stream with a few LEQL queries.
Since we’re feeding our metrics into the regular request log, the first thing we need to do is pick out Hystrix payloads- ‘where(type=HystrixCommand)‘ is a good filter to start with:
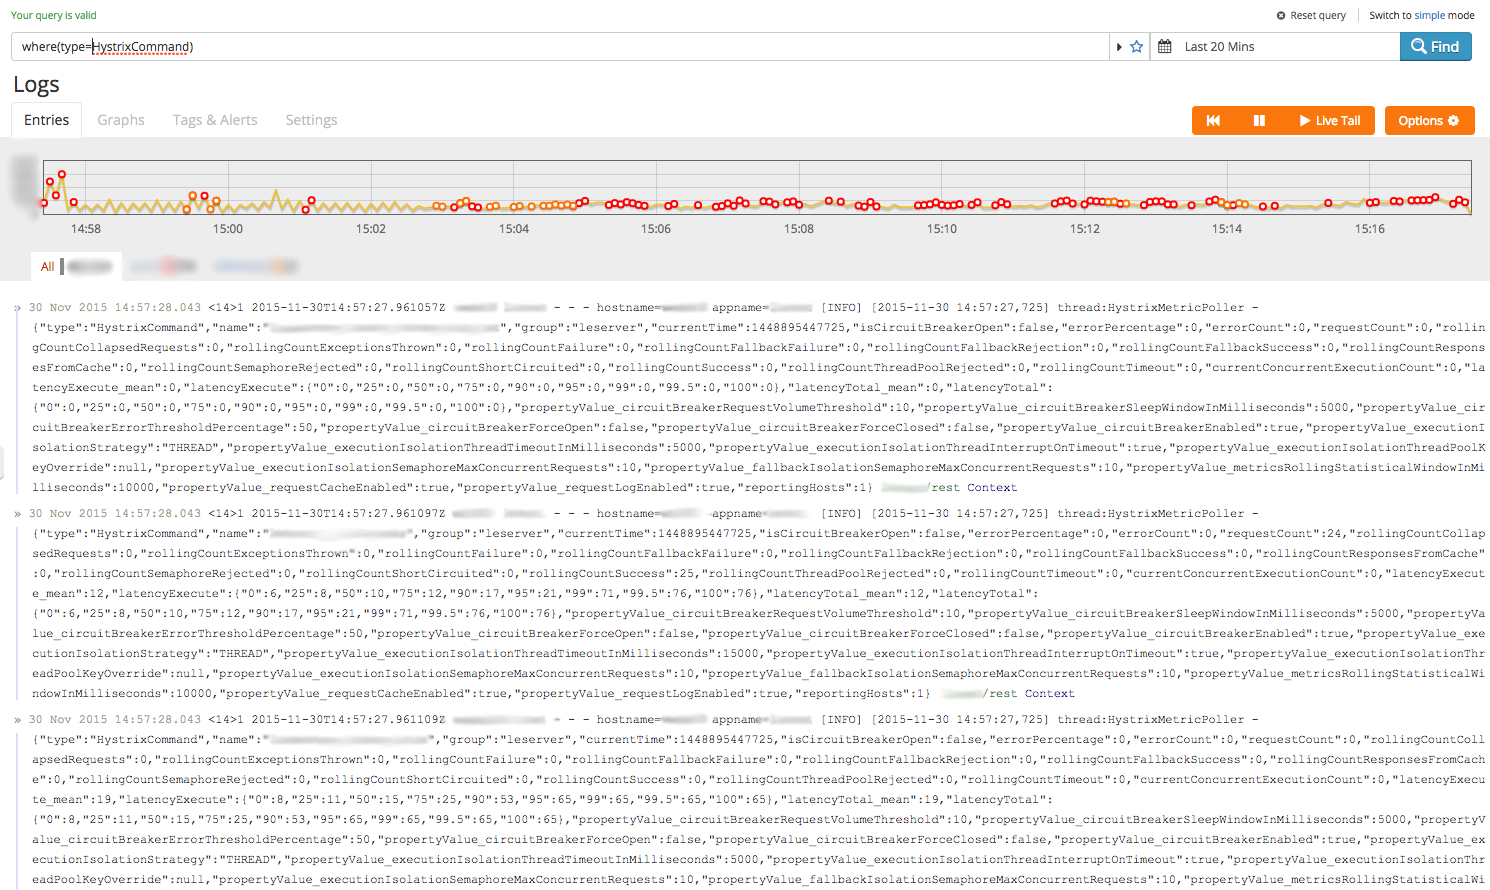
If you’re logging at a high volume, a predicate like this in the WHERE() statement will give your search a performance boost because it uses the index effectively to eliminate irrelevant entries.
You can see Hystrix gives us quite a lot of metrics to play with (by the way, you might want to enable text-wrapping as the JSON objects are pretty big). Let’s see if we can get a rough idea of the slowest downstream calls our service is making. To do this we’ll need a couple more keys: ‘name‘ and ‘latencyTotal_mean‘. Hystrix already does some aggregation on these values (e.g. calculating means, recording a distribution of execution times) so just taking the max is probably sufficient:
where(type=HystrixCommand) groupby(name) calculate(max:latencyTotal_mean)
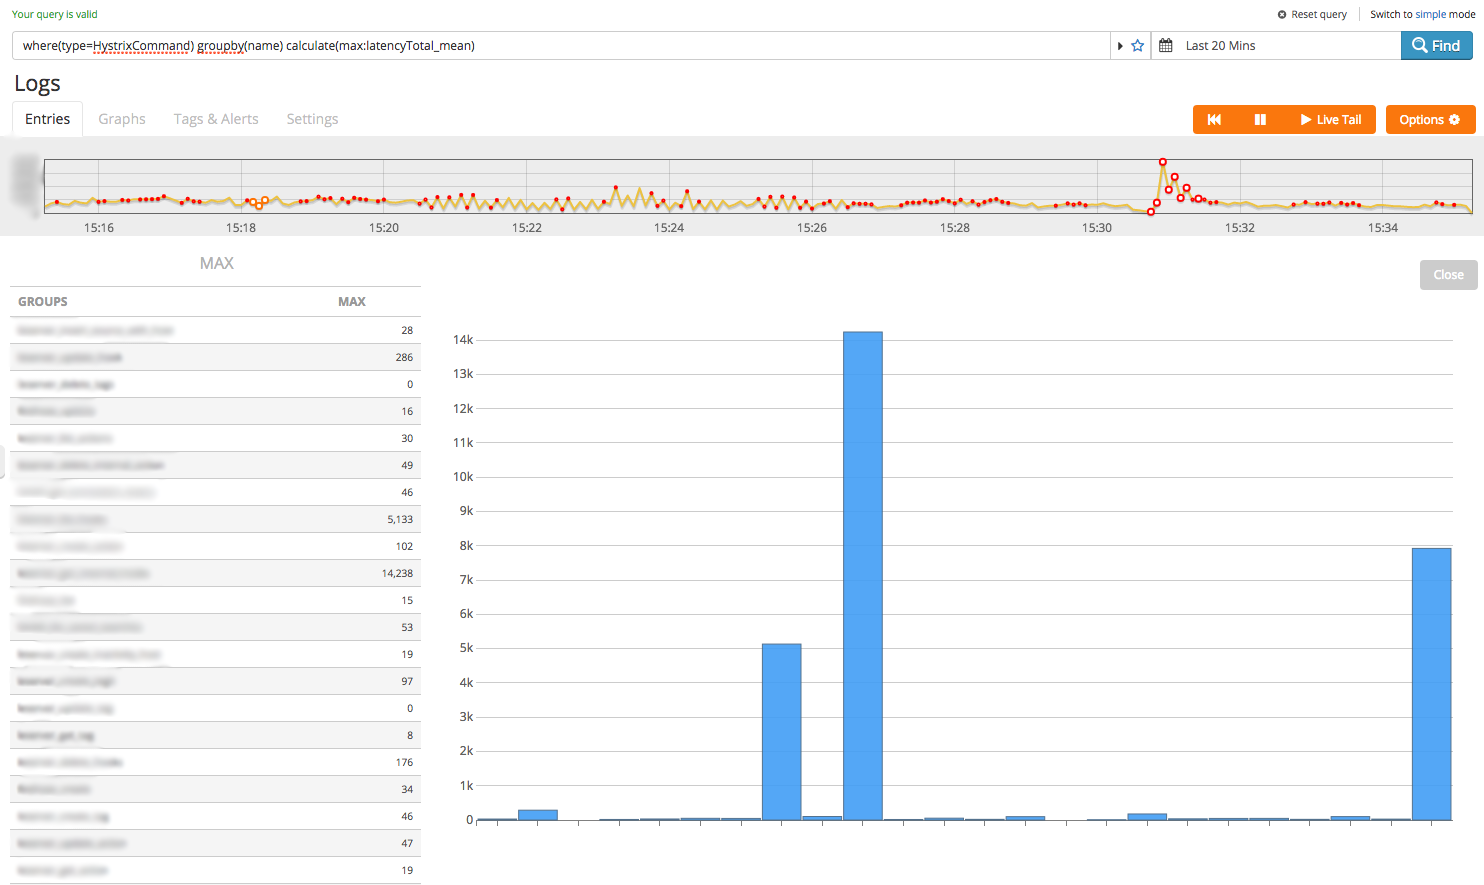
Hmm… we’ve got some values but it doesn’t really show us the main offenders. Let’s sort the result:
where(type=HystrixCommand) groupby(name) calculate(max:latencyTotal_mean) sort(desc)
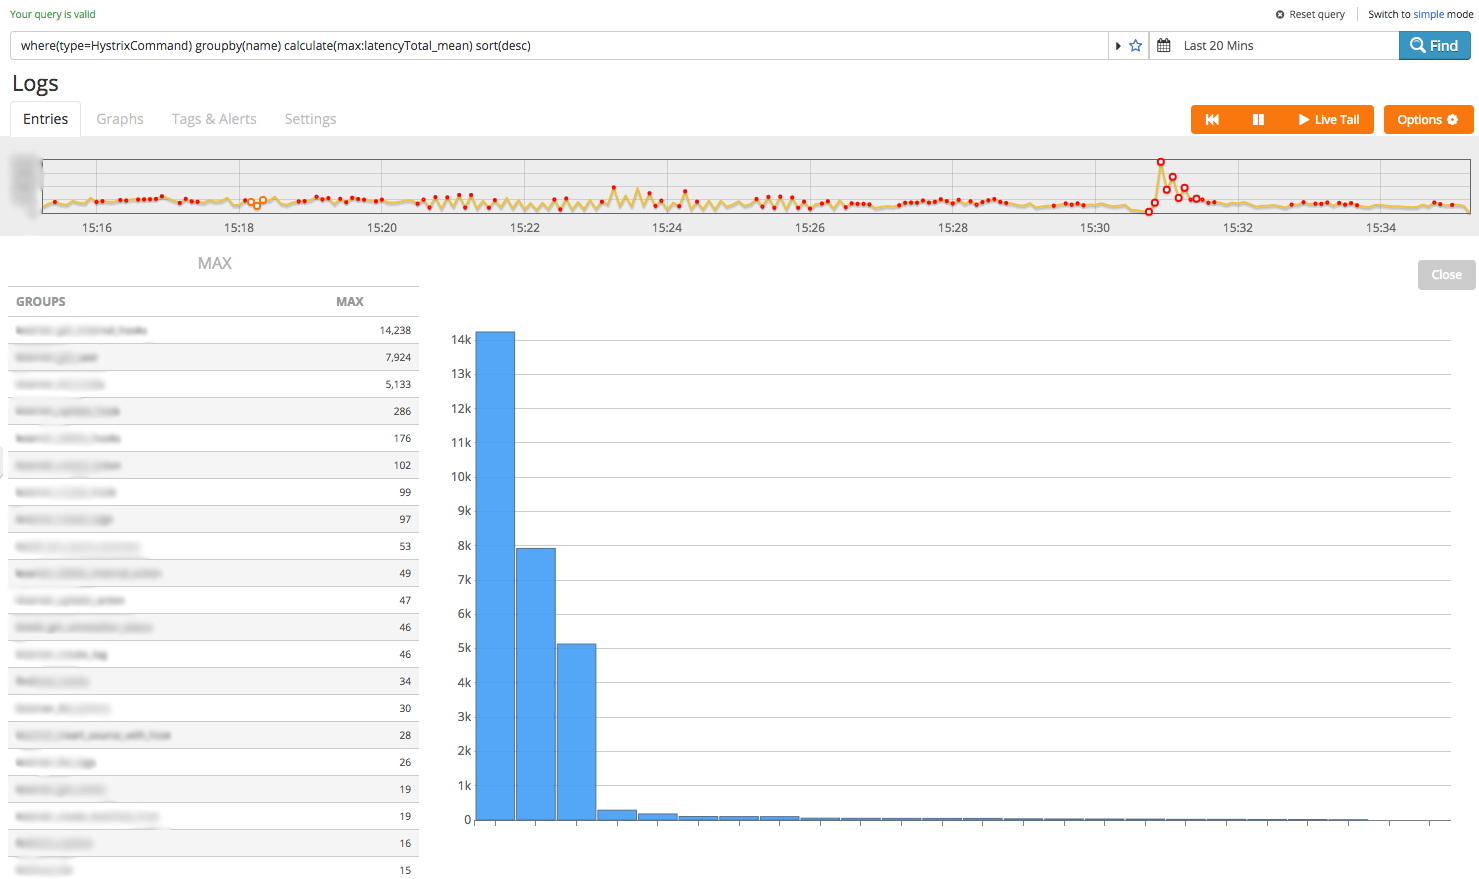
Much better- turns out less than a handful of internal calls are taking up most of the execution time. Let’s see how the slowest one was performing over the last 24 hours:
where(type=HystrixCommand AND name=<HYSTRIX_COMMAND>) calculate(max:latencyTotal_mean)
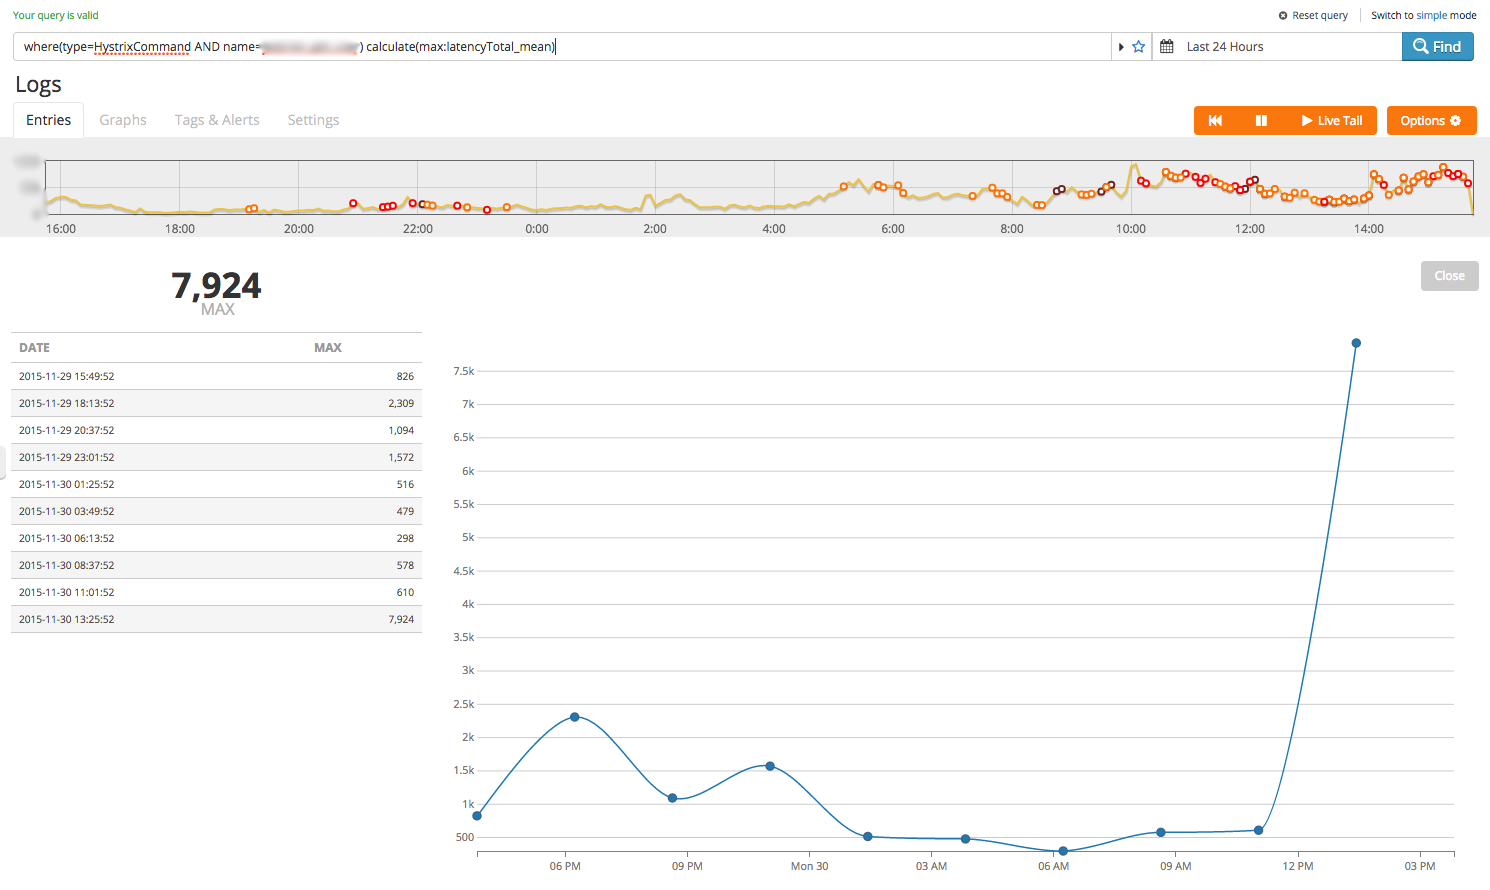
This shows a spike the end of the time window but the granularity is a little low- we can bump the number of data points in the result with the ‘timeslice()’ statement:
where(type=HystrixCommand AND name=<HYSTRIX_COMMAND>) calculate(max:latencyTotal_mean) timeslice(200)
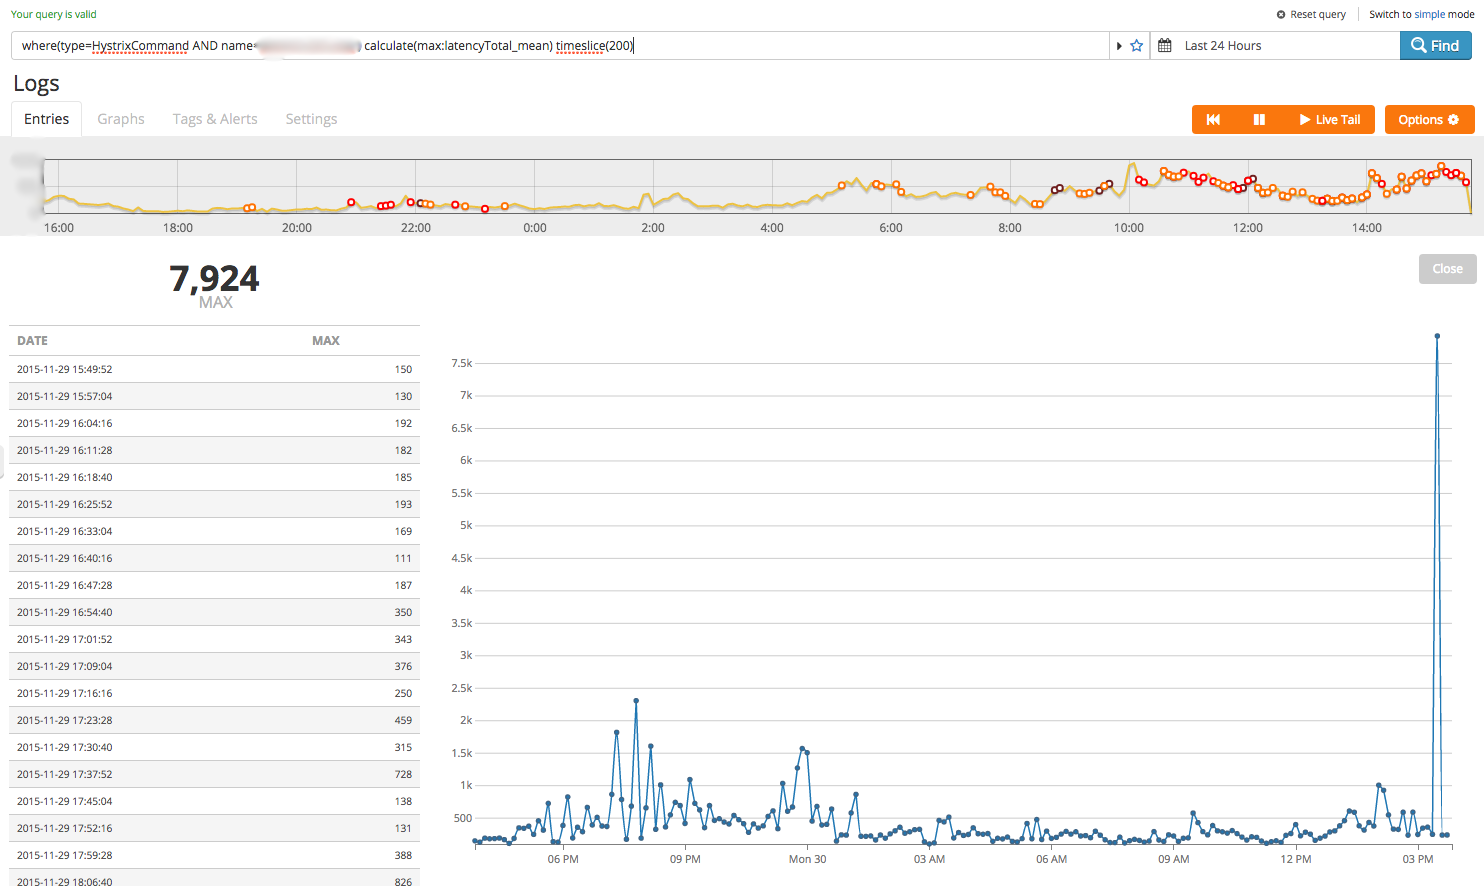
Luckily it looks like the sharp increase is just a transient phenomenon. Let’s double-check that traffic is being evenly distributed across all instances of this service. Hystrix keeps track of the number of requests each call has made so we can get a rough idea using the ‘requestCount‘ key:
where(type=HystrixCommand) groupby(hostname) calculate(sum:requestCount)
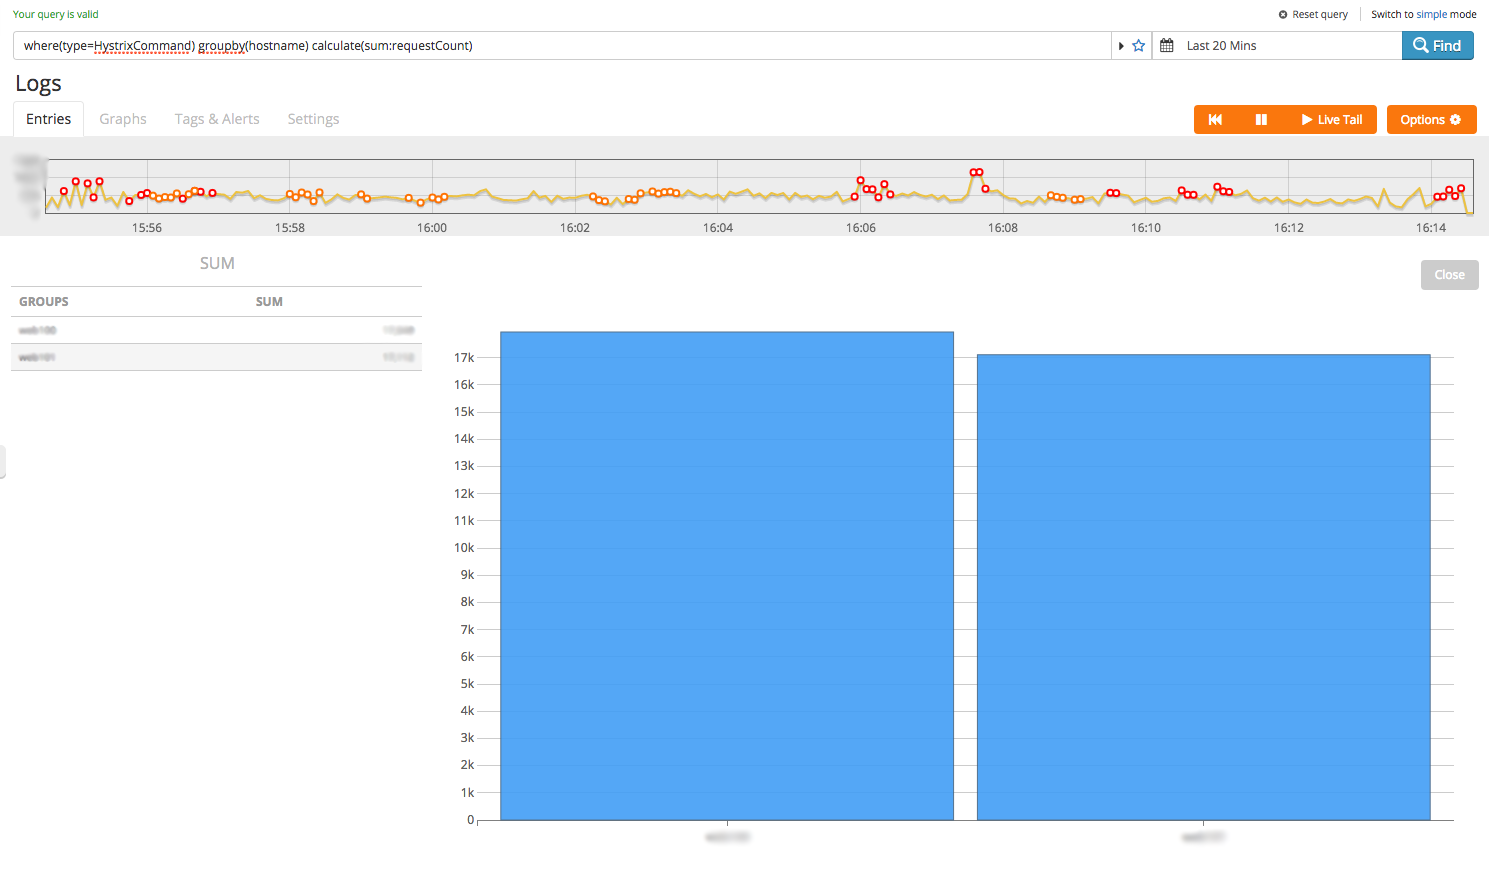
Ok, we only have 2 instances reporting metrics and the traffic spread seems pretty even. We know the slowest calls but are they the ones with the most traffic?
where(type=HystrixCommand) groupby(name) calculate(sum:requestCount) sort(desc)
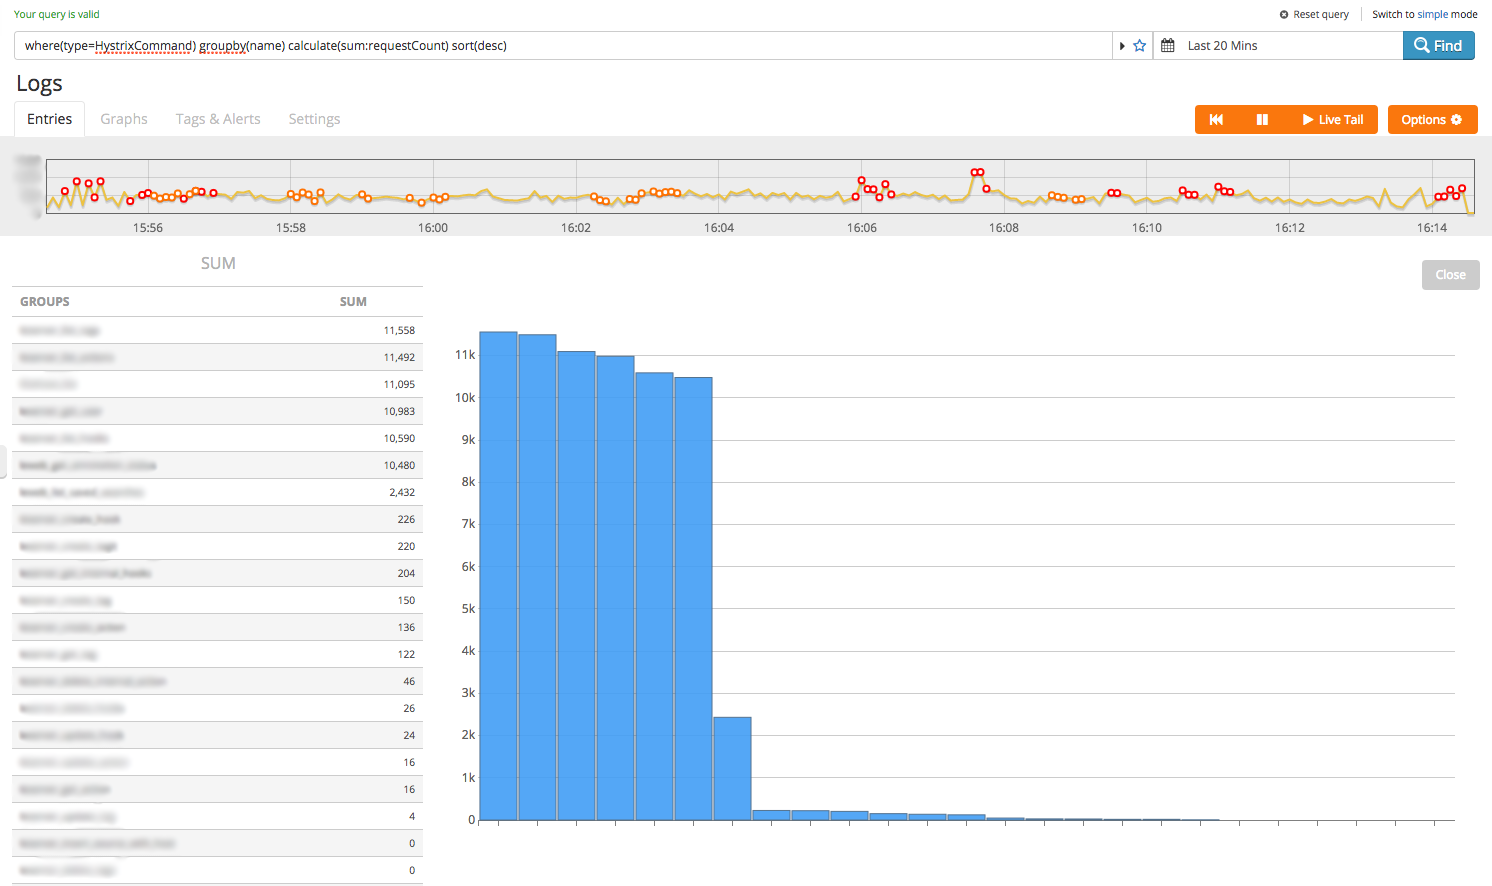
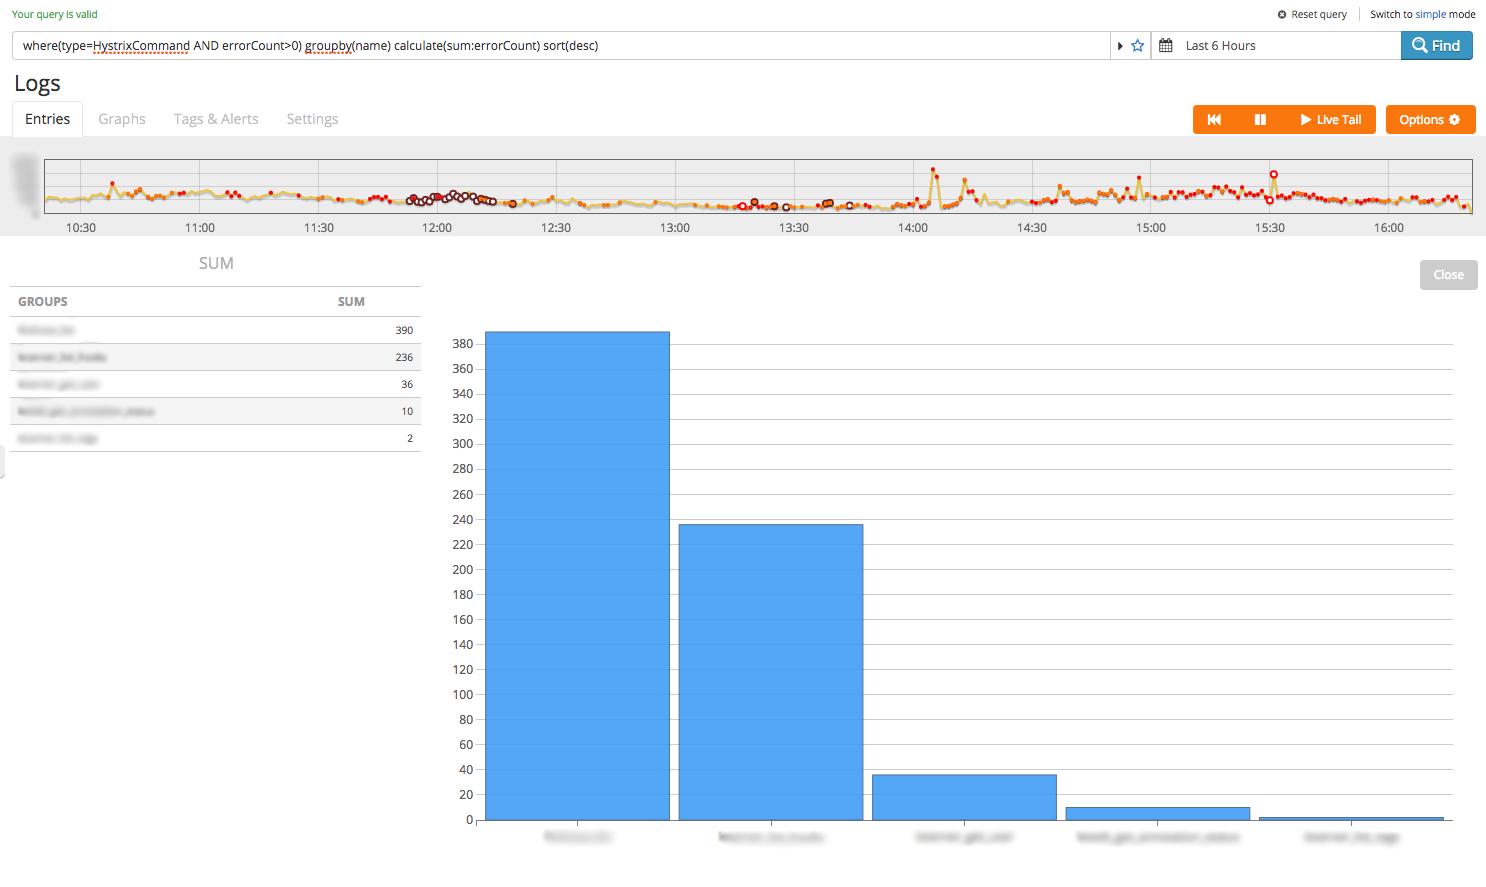
Turns out the answer is ‘not always’. Some calls seem to be quick despite servicing high request-rates relative to slower ones. But are they always reliable? The Hystrix dashboard gives you error counts and a big red dot when a command is failing sporadically, but what calls were the least reliable in the last 6 hours for this service?
where(type=HystrixCommand AND errorCount>0) groupby(name) calculate(sum:errorCount) sort(desc)
So in this case the link between request volume, latency and error rate is more complicated than we first thought. At this point I’d want to take a couple of actions:
- Start looking at the relevant code paths- the queries above have given me a few obvious starting points
- Set up some alerts for cruical calls if error rates or latency creep up- another benefit of sending these metrics to Logentries
Hystrix gives you a lot more stuff to query- for example percentiles, thread groups, e.t.c but hopefully this gives you an idea of how recording this kind of production data through our platform and analysing it over time gives you better insight into what your code is really doing.