Interested in learning a couple insider tips to gain more value from your logs using additional structure?
Specifically, we will show how to easily introduce key-value pair (KVP) format on Nginx and Django logs.
Of course, the approach is not restricted to those two types of logs, and can be applied to numerous applications.
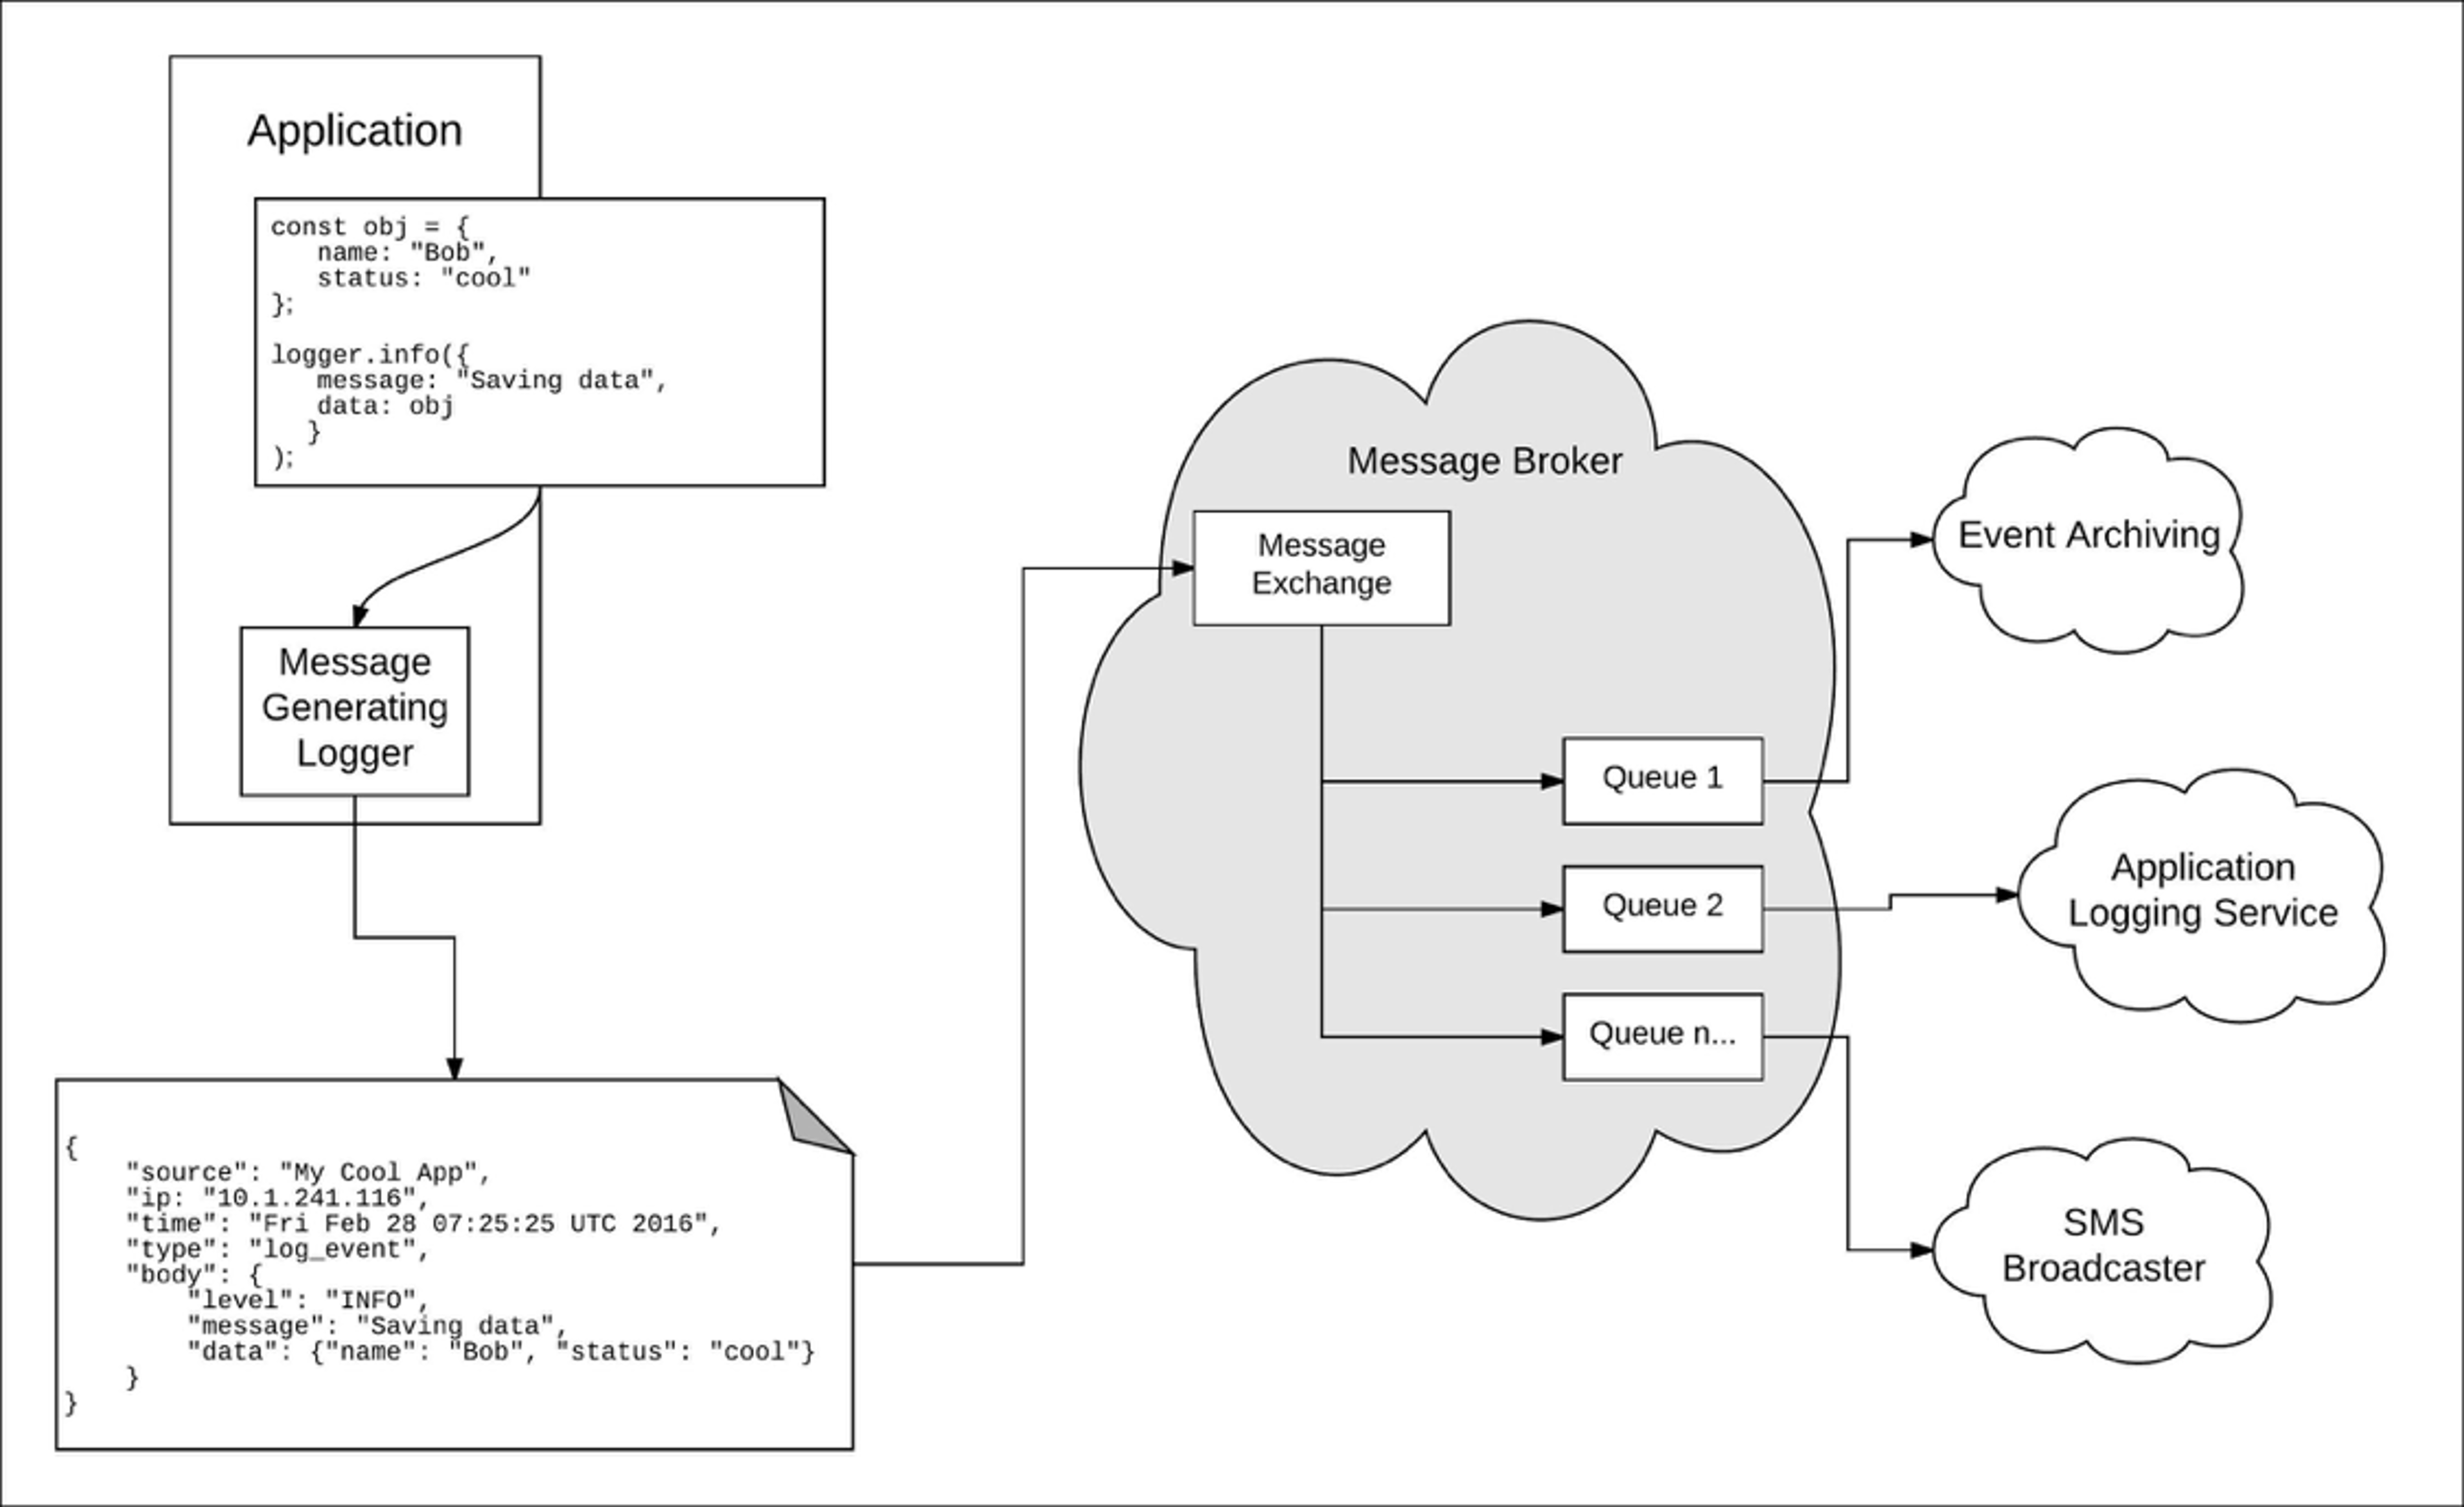
Previously, our Head of Product, Marc Concannon explained how logging information in JSON format makes it possible to leverage some of the most valuable Logentries features. Today’s post details one of the best practices for logging: using key-value pairs.
The best way to introduce application-specific metrics into your logs is to modify log statements in your code so that it presents information in KVP format.
As you are going to see, we can easily log useful information in KVP by just changing a couple of lines in some configuration files. We’ll illustrate this by showing how you can get distributions of the server request time powered by Nginx, as well as how to refine your logging practice in a Django app.
Log Formatters
As mentioned, domain-specific information for your application usually go into the log message provided by system developers.
There is also data systematically added by the logging library. This data often consists of a timestamp and a priority level, e.g. “INFO.” There can be many other parameters added to each log statement by the logging library.
The interesting part is how these parameters are formatted can generally be configured.
Here is when we’ll introduce some KVP into our logs.
Nginx
The Nginx (ngx_http_log_module) module from the Nginx doc, provides the ability to configure access log attributes and formatting via the access_log and and log_format directives. access_log sets the access log logging strategy while log_format describes the logging format.
From the Nginx documentation, the default format is:
log_format combined ‘$remote_addr – $remote_user [$time_local] ‘
‘”$request” $status $body_bytes_sent ‘
‘”$http_referer” “$http_user_agent”‘;
In addition to having variables that represent status codes or user agents, it is possible to refer to information like request time, which represent the request processing time. We now extend the default Nginx configuration, adding request_time parameter.
We call this new format “KVP”:
log_format KVP ‘$remote_addr – $remote_user [$time_local] ‘
‘”$request” status_code=$status request_time=$request_time ‘
‘$body_bytes_sent “$http_referer” “$http_user_agent”‘;
With this format, log events generated by the Nginx server look like this:
example.com – – [01/Oct/2014:00:00:37 +0100] “GET /my/url/ HTTP/1.1” status=200 request_time=0.231 “http://example.com/app/” “Mozilla/5.0 (Macintosh; Intel Mac OS X 10_9_5) AppleWebKit/537.36 (KHTML, like Gecko) Chrome/37.0.2062.124 Safari/537.36” “-”
When log events in these formats are sent to Logentries, the query language makes it easy to generate graphs for the KVPs. For instance, Figures 1 and 2 respectively show the distribution of status codes higher than 400 over time, and the average request time of requests processed by an Nginx server.
[
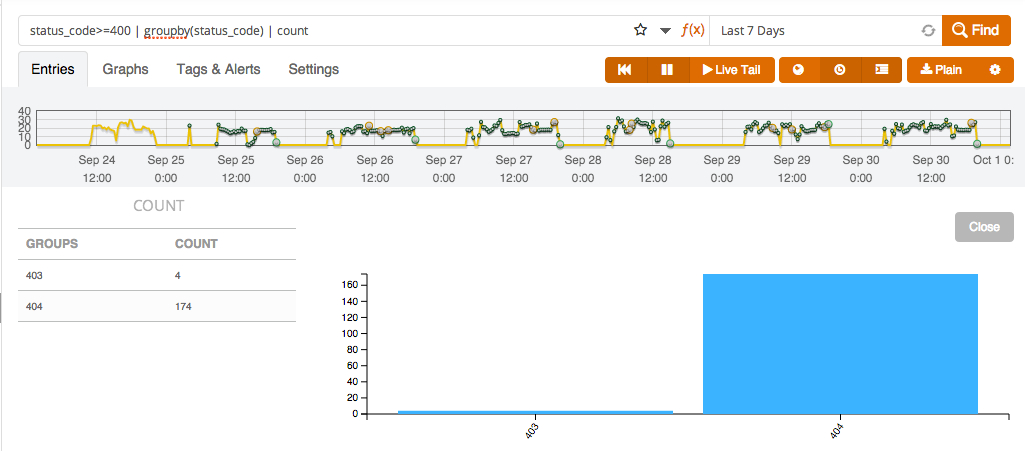
Figure 1
[
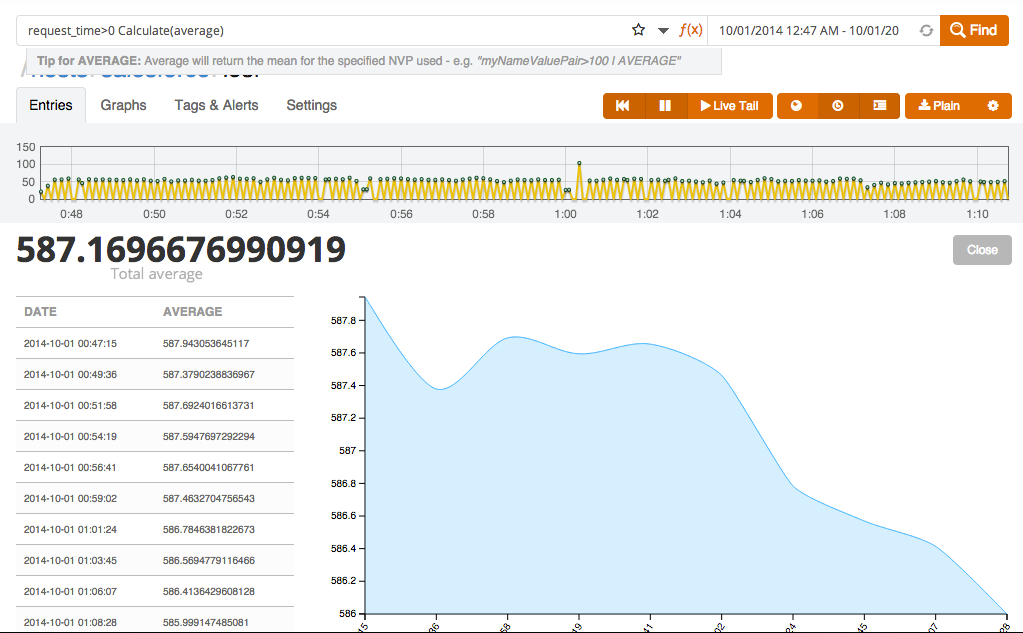
Figure 2
Going back to the log view in Logentries makes it possible to identify those broken URLs.
Information shown in Figure 2 makes it possible to visualize increases of the request latencies occurring during the times of the day where traffic is high on the web site.
Django
The approach described above is not just restricted to Nginx.
Let’s now explore modifing Django configuration in order to log KVPs:
As for Nginx, Django makes it possible to configure its logging format [see for instance https://docs.djangoproject.com/en/dev/topics/logging/ for details].
From the Django documentation, this formatting can look like:
‘formatters’: {
‘simple’: {
‘format’: ‘%(levelname)s %(message)s’
},
‘verbose’: {
‘format’: ‘%(levelname)s %(asctime)s %(module)s %(process)d %(thread)d %(message)s’
},
}
Here are other parameters that are available for formatting. We now consider a format where severity level, Django module (python file) and line number are represented as KVPs:
‘formatters’: {
‘simple’: {
‘format’: ‘%(levelname)s %(asctime)s %(message)s’
},
‘verbose’: {
‘format’: ‘severity=%(levelname)s %(asctime)s %(message)s ‘
‘module=%(module)s line=%(lineno)s’
},
},
[
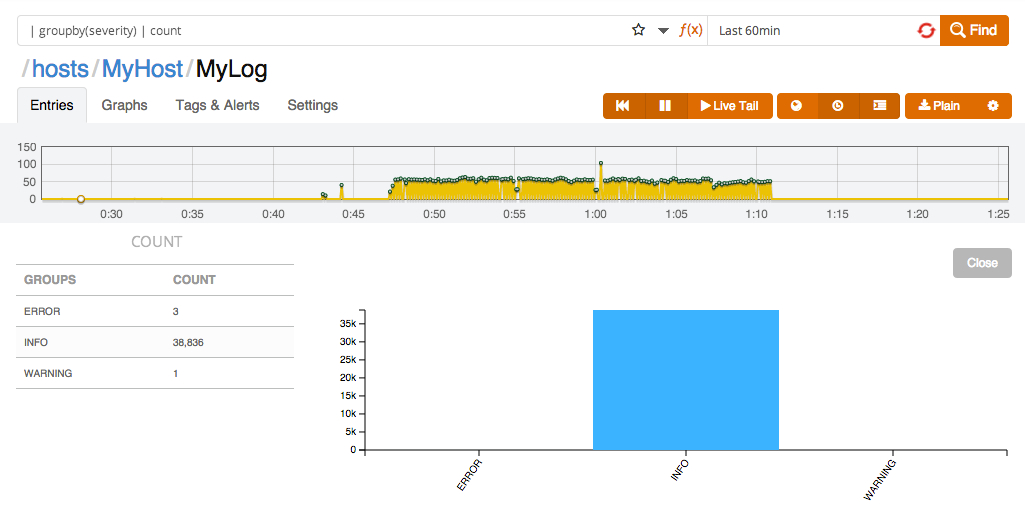
Figure 3
[
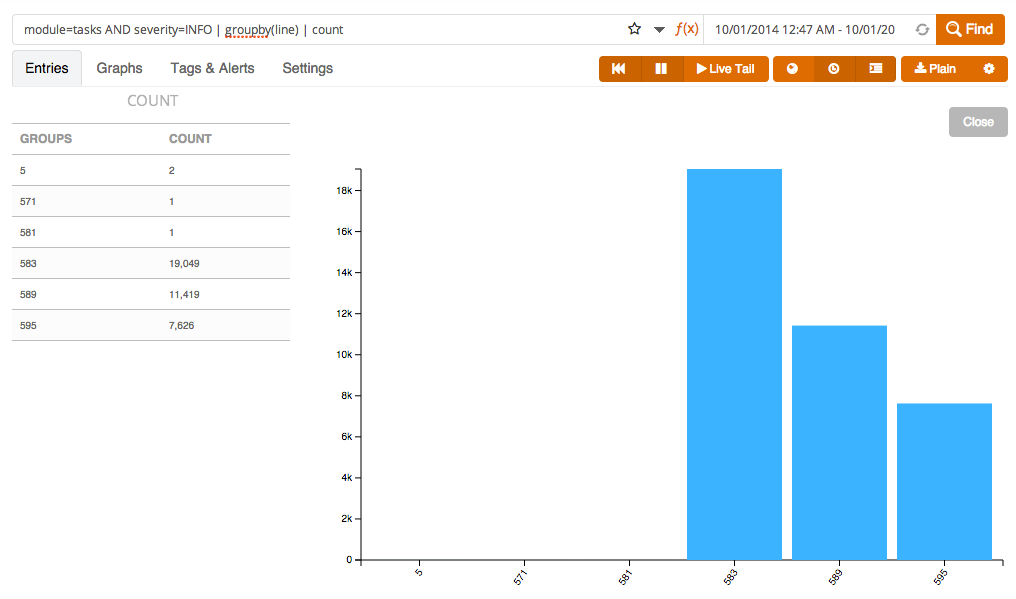
Figure 4
From there, we can get distributions of severities within a specific log, as illustrated in Figure 3.
This example quickly shows that the process that was logged mostly performed OK during the selected time range. Users can go to the log view within Logentries to get details on the log event with ERROR or WARNING severity. Figure 3 also indicates that a substantial amount of log events with INFO severity have been logged.
Taking advantage of the KVPs introduced in the logs again, Figure 4 provides the distribution of log events with severity INFO within the source code of the “tasks” module of the Django app under consideration. It shows that all those “INFO log events” come from only three log statements in tasks.py. Therefore these log statements appear to play a critical role in observing the runtime behavior of the process being logged.
In this case, it seems that it would be worth adding more information into those log statements, for instance by adding KVP into them!!