Welcome to our new four-part series on the vulnerability management reporting capabilities of InsightVM. In this first post, we will cover our Executive Report, along with what it is, what you learn from it, and how you can use it.
We’ve heard from many executives over the years that security team reports often provide little or no value because they only show a snapshot of a point in time, rather than an ongoing demonstration of how the security program is improving over time. On the other hand, security teams can become frustrated by how difficult it is to compile a simple report that provides just the right amount of information to keep their executive team up-to-date on progress.
It is because of this that we have developed the Executive Report inside InsightVM so that companies can easily report on month-over-month trends in their vulnerability management programs.
The following are the types of information you can find within the Executive Report, along with how it best informs executives of the efficacy of your security program:
Assessed assets vs. risk
Right off the bat, this first section highlights the total risk score for your organization alongside the total assets assessed in the same time period.
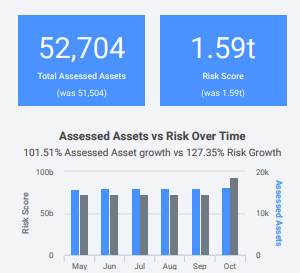
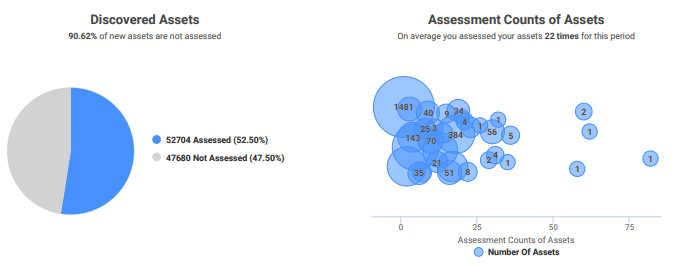
This helps you to quickly evaluate how much of your total environment has been assessed and how the risk score moves as more assets are scanned. From there, you can understand how often assets are assessed and what percentage of new assets are assessed, so you can keep track of how you’re doing in maintaining visibility into the vulnerability risks in your environment. Most compliance regulations require that you scan assets that are in scope on a regular basis, so this is an easy way to keep a record of that.
InsightVM is designed to collect, prioritize, and remediate vulnerabilities, and in this first section, you gain a comprehensive overview of the “collect” phase. This will help executives gauge the level of visibility security has into the network and how well the team is managing risk.
Security vulnerabilities by criticality
The second section shows how many vulnerabilities were discovered in the past month and, of those, how many were critical.
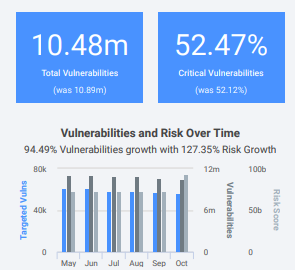
As new vulnerabilities are introduced, the risk score is affected, which is why it’s useful to keep a close eye on the relationship between these two metrics.
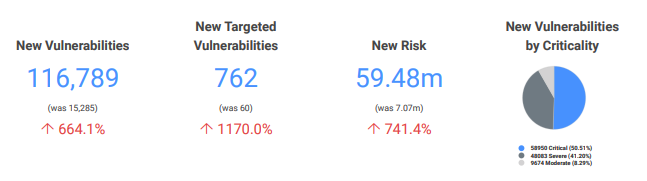
Of the vulnerabilities found within a specific time period, this section will show you how many were critical, as well as whether exploits and malware kits were detected that would increase the chances of a security incident. With visibility into these key areas, executives get a clear sense of where their risk lies and what needs to be addressed. This is the prioritization phase of InsightVM.
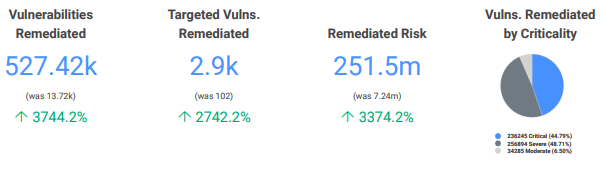
Remediation success
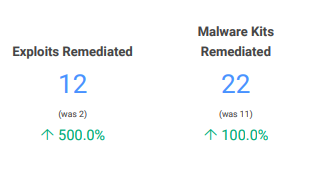
Can we get a drumroll, please? It’s now time for the section most executives have been waiting for: remediation metrics! At the end of the day, executives want to see how well their team has kept up with remediating and fixing vulnerabilities in their environment and reducing overall risk. In this section, they are able to use KPIs such as the total number of vulnerabilities, exploits, and malware kits remediated, remediation by criticality, and remediation by risk to measure the outcome of the team’s remediation work.
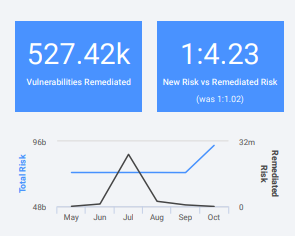
This section also includes the ratio of new vs. remediated risk. For example, if the new risk is 1 (see the right-hand blue box below) and the remediated risk is 4.3, that means you’re reducing risk faster than new risk is being introduced into your environment. This is a great indicator of overall security posture.
Another useful statistic in this section is the average time (in days) it takes to remediate vulns by criticality level. Executives want to know not only that remediation is happening, but also that it’s being completed in a timely manner. While remediation is ultimately on the IT team to perform, it is the responsibility of the security team to collaborate with their IT counterparts to develop solutions to these problems and keep remediation efforts on task. If you practice SecOps, this should be a smooth process. If not, see this article for guidance on establishing a SecOps culture.
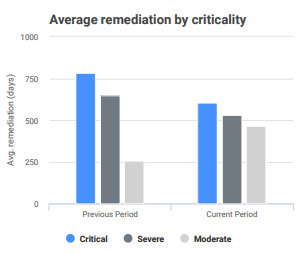
Ultimately, you want to see this chart trend downward over time as remediation time improves. With InsightVM’s Remediation Projects feature, security teams can work more cohesively with their IT teams to reduce the mean time it takes to remediate vulns. As you leverage this feature within InsightVM, you should see these numbers begin to improve quite a bit faster. Unsurprisingly, this report reflects the remediation phase of InsightVM.
Digging deeper
The last four sections of this report—Program Improvements, Location Tags, Owner Tags, and Criticality Tags—provide more context around the use of InsightVM, should you need it. Asset tagging helps you prioritize group assets in meaningful ways. Specifically, location tagging shows you the top locations of your users, as well as new risk and remediated risk by location. Owner and criticality tags can be applied as needed to segment activities based on overall risk.
Using this report
Monthly trending reports such as the Executive Report help organizations share progress and gain visibility that may be otherwise hard to obtain. Gathering such a report manually would require having your security team spend valuable time running custom queries and molding the data together in a meaningful way, which is no easy feat. It can be easily shared with other stakeholders within your organization and used in security and metrics presentations to communicate progress clearly and succinctly.
The metrics in this report are the ones we’ve seen security teams zero in on year after year to keep tabs on their security program, so we’ve tied a bow around them in this new report to give executives an easy and actionable bird’s-eye view of remediation efforts and many key vulnerability management statistics to keep you in the know.