
Our recent “Seeing 20/20 with InsightVM” customer webcast on InsightVM dashboards and executive summary report was very well-attended, and we received lots of great questions from attendees. We answered many of these questions live, but there were a lot more we couldn’t get to. In this blog post, we wanted to address the commonly asked questions.
How can I filter the data shown in my dashboards? And how do I determine which filters to use for different searches?
Many of the dashboard cards in InsightVM support filtering to display the desired data sets. In order to filter a card, click on the “Expand Card” link at the bottom of the card. The drill down page will open, and you’ll see an “Add Criteria” button and a “Load Query” button. You can click the “Load Query” button to load a query that you created in Query Builder. Alternatively, you can click the “Add Criteria” button to start constructing your query to filter the data. The available criteria is categorized and searchable to make it easy to build your query. You can also save this query and reuse it in other places like query builder, projects and goals. Once you are done building your query, click on “Save” to save your filtered card.

Is there a way to standardize dashboards across all InsightVM users?
InsightVM dashboards are shareable with other users. With this feature, you can build standard dashboards for your teams to monitor. In order to share a dashboard with other users, when you hover over the name of the dashboard, you will see a pencil icon to click to edit the dashboard and share.
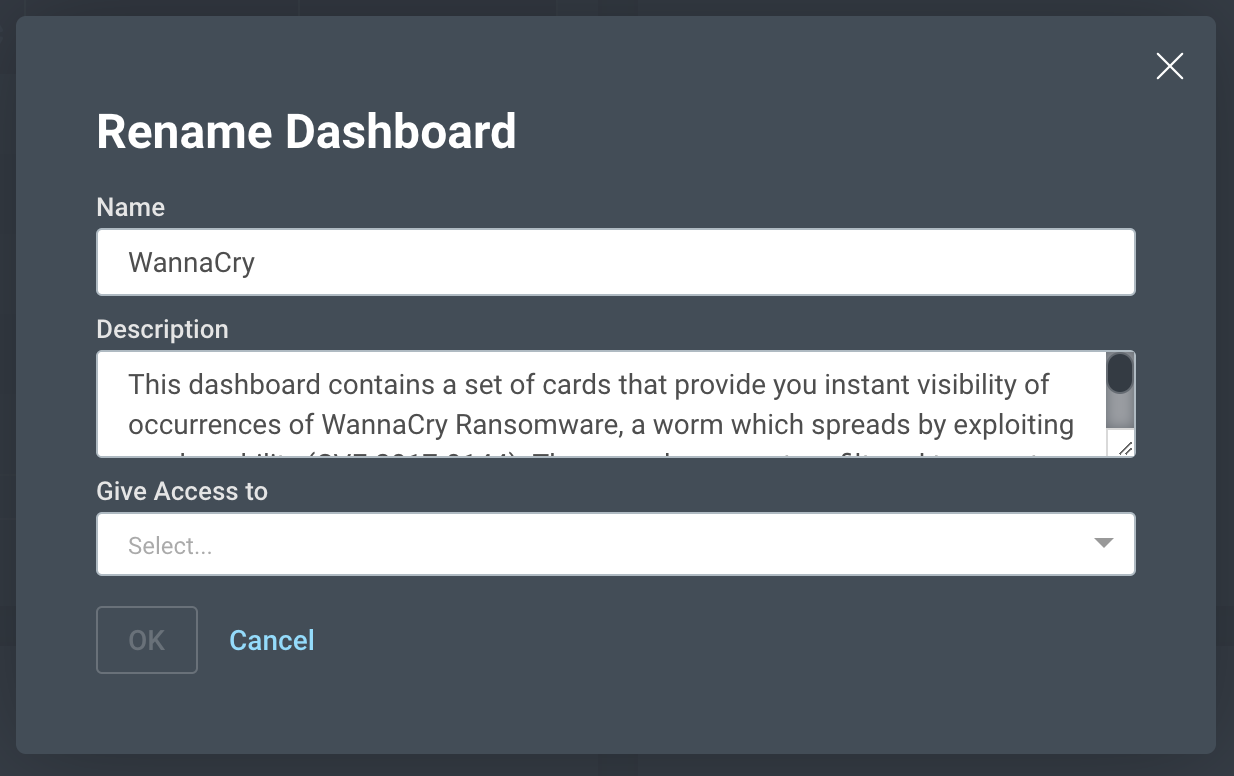
If other users have restricted access to assets, their dashboard will only show data based on their access rights.
Can you add columns in the cards when expanded?
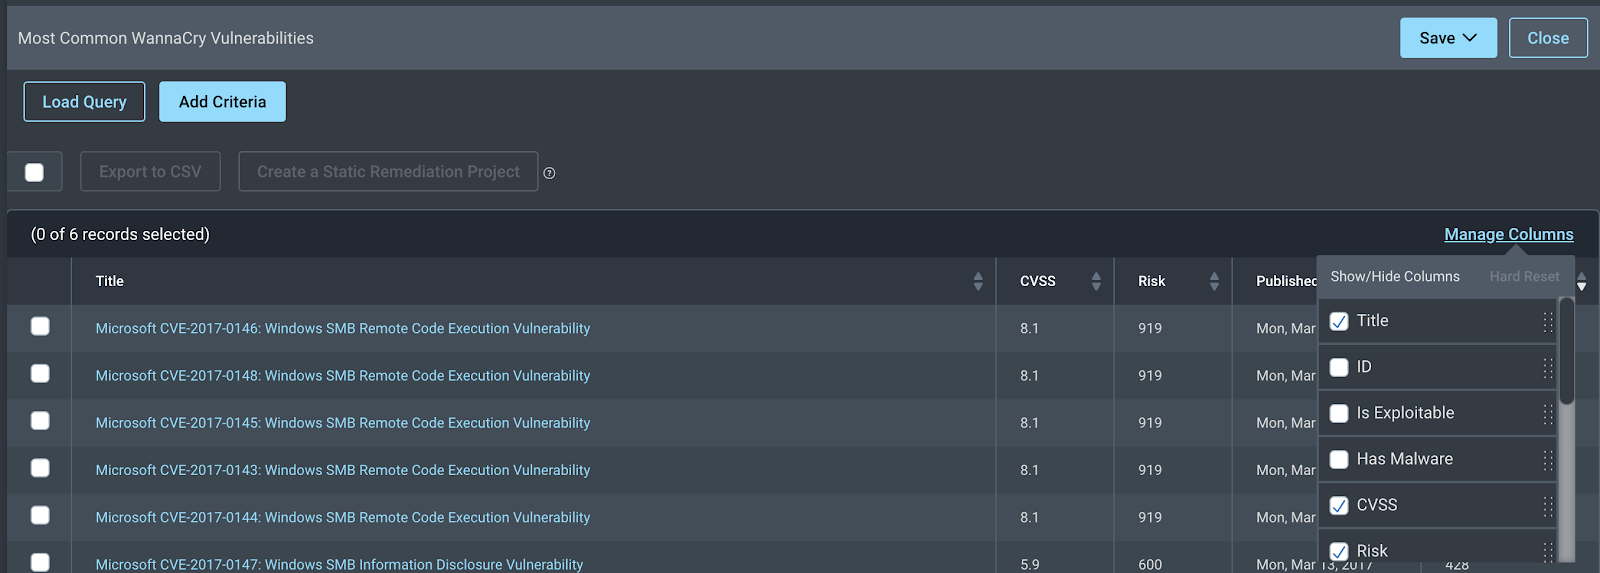
Every table within the drill down pages for cards has the “Manage Columns” option to show/hide columns. As long as an attribute is listed there, they can be added to the table by clicking the checkbox. However, users cannot add attributes that are not listed in that drop down.
How is the finding.firstfound filter formulated? Is it based on the finding first found by NVD?
This filter takes a date or a relative time frame as an input and, for each vulnerability, it compares that date to the earliest date found across all instances of that vulnerability on each asset. This date is based on the scan or agent data collection time. For the date that a given vulnerability was published on NVD, we recommend using the “vulnerability.datePublished” filter.
Can you customize your own card?
You can filter many of the existing cards to change/filter its content based on your objectives.
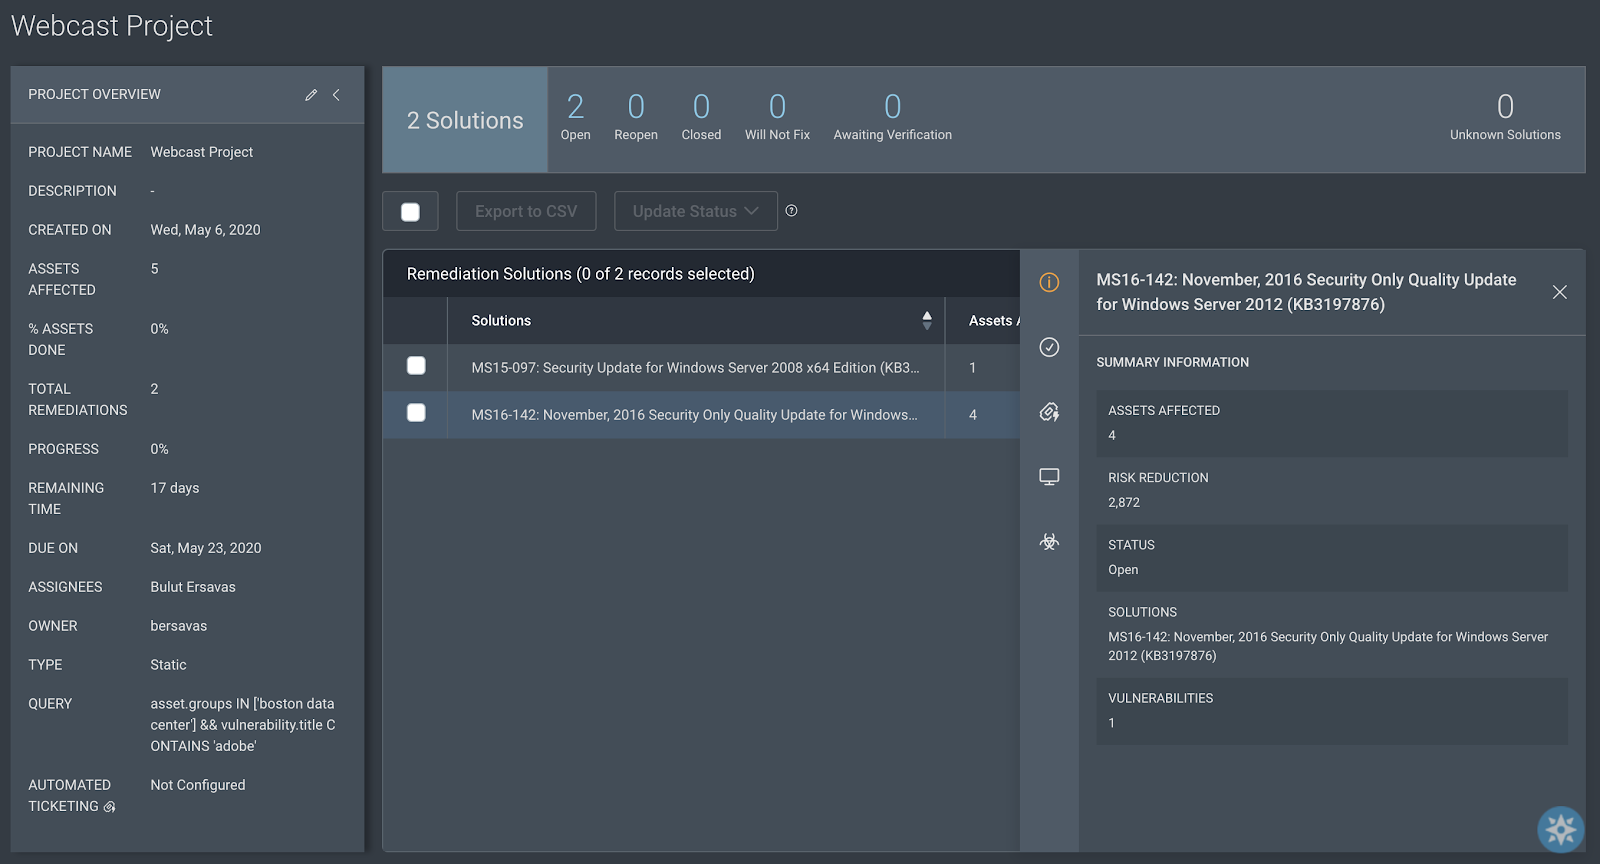
Is there a report or card that will show our enterprise risk for a site and what the risk value will be if we implemented a patch or remediation setting? For example, if we patched Adobe or removed it, our risk would go from 700 to 600.
The best way to accomplish this use case in InsightVM is to use Remediation Projects. When you define your scope, make sure to include specific vulnerabilities (e.g. vulnerability.title CONTAINS 'adobe') like in the example shown in the screenshot below. You will then be able to see all solutions to remediate and how much risk reduction each one will provide.
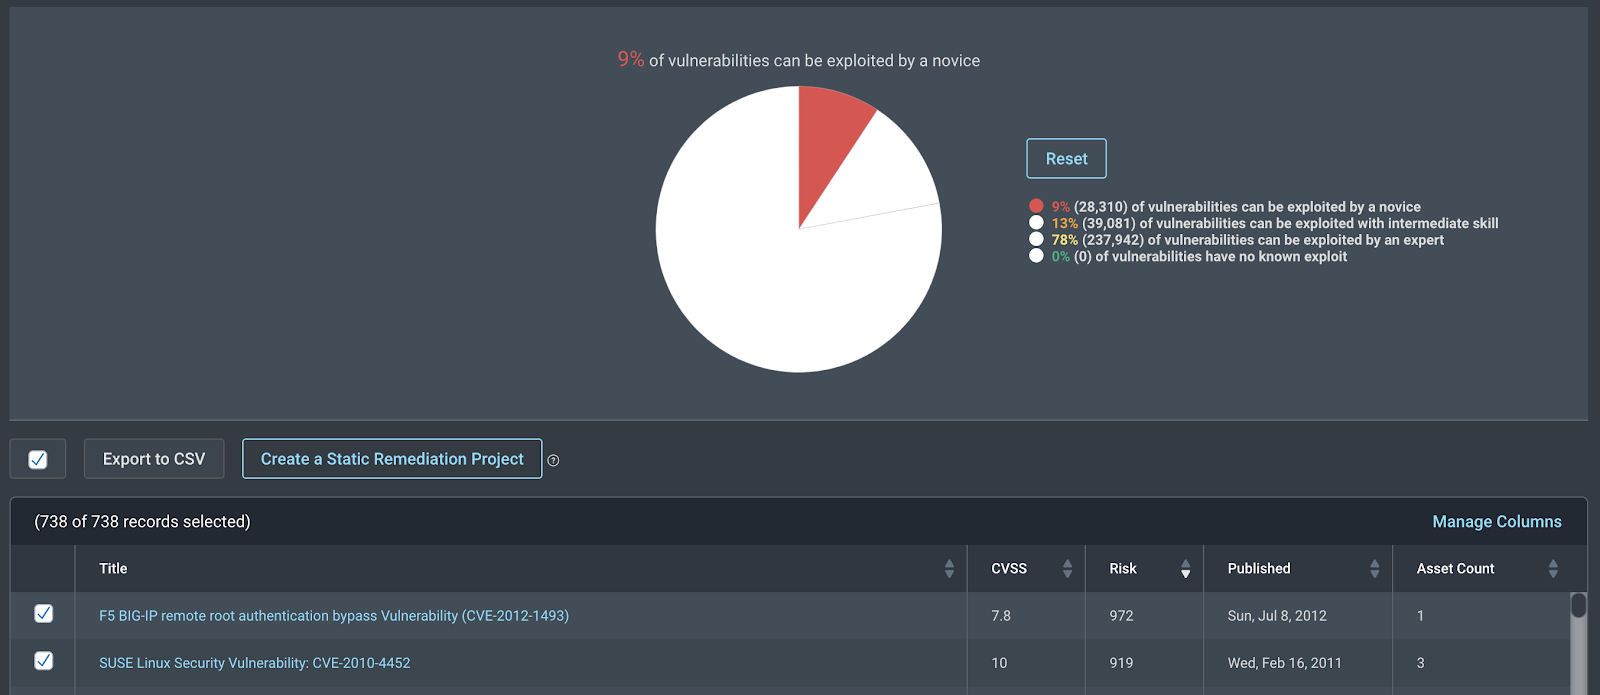
How can “Exploitable Vulns by Skill Level" be translated into actionable project plans?
When you expand this card, you will be able to filter it further to reflect the environment (e.g., asset group, tag or site) you want to focus on (see above instructions). Afterwards, we recommend clicking on the novice slice of the pie chart as an example and selecting all or some of the vulnerabilities in the table below to create a remediation project. Remediation Projects are a great actionable way to remediate vulnerabilities in your environment. If you are interested, we highly recommend this blog post and the help pages referenced in the previous questions.
Is there a way to find the repeated vulnerabilities card?
After clicking on the “Add Card” button on the dashboard, search for “Most Common Vulnerabilities,” which provides a list of vulnerabilities that are repeated in your environment the most. You can expand the card to see more vulnerabilities.
In the "New vs. Remediated Vulns" card, when expanded, is there a way to consolidate remediated items into groups or categories (i.e., Microsoft CVE items that were remediated) rather than a list of each item?
When you expand the card, you can add a query/filter to focus on a specific group of assets or vulnerabilities. However, you cannot have a group-by-group comparison in one card. You will need to create a separate card for each group.
Is there an option to explore the vulnerabilities with age?
Vulnerability Publish Age by Severity (or CVSS Score) card is a great place to start. The same card exists with a focus on exploitable vulnerabilities as well.
Can you share or send a dashboard or just a card to another user without the user needing access to InsightVM?
No, this option is not available in the product. The only feature that allows something like this is a remediation project. Depending on your use case, you might find some value in using a remediation project to share information with someone who does not have access to InsightVM.
If an admin leaves and access is disabled, what happens to the dashboards if it was shared? Can ownership be shared? Can multiple admins modify a shared dashboard?
Currently, it is not possible to share or transfer the ownership of dashboards. However, you can clone a dashboard that has been shared with you and share the new dashboard as necessary. In order to clone a dashboard, you will see a clone/duplicate icon when you hover over the name of the dashboard.

If users who shared dashboards with others leave the company, will their dashboards be removed?
No, they should be manually deleted by the user account who owns them.
Is there any reason why the “Vulnerability Risk Score Over Time” card does not have an “Expand Card” option? It would be valuable to have an option to limit data by site or asset group.
Thanks for the feedback. We are evaluating the possibility of adding the expand option on this card as well.
Rather than searching on CVE or specific vulnerabilities, what card can show us a good picture of Microsoft patch health?
We recommend using the “New vs. Remediated Vulnerabilities Over Time” card with the following query: vulnerability.title CONTAINS 'microsoft'
Where can we get previews of upcoming features in the cloud dashboard? (e.g., new cards or other new functionality)
We run many early-access programs for customers who are willing to share their feedback with us as we build new features. Please reach out to your Customer Success Manager (CSM) to ask about which programs are available and to be included in the relevant ones.
Thank you to all our customers who attended the webcast and asked these great questions. We hope that these answers help you achieve your goals. We’re looking forward to seeing you all during our next webcast in June.