We love our policy Dashboards. They are new, hot, intuitive, robust and really useful. In our latest release of Nexpose, version 5.2, we've made two major enhancements to our configuration assessment capabilities:
- A policy overview dashboard: To understand the current status of compliance of configurations delivering a summary of the policy itself.
- A policy rule dashboard: To provide further details for a particular rule and the current compliance status for that rule.
What makes these dashboards so useful?
The policy overview dashboard page
This dashboard gives users the ability to understand their overall policy compliance stance within their organization. Users have the ability to drill down into any of pre-configured-in policies included within Nexpose (currently related to USGCB and FDCC, more to follow) and visually see their compliance status for that particular policy. Those visual indicators as well as some tables will allow users to know everything they need about a particular policy such as:
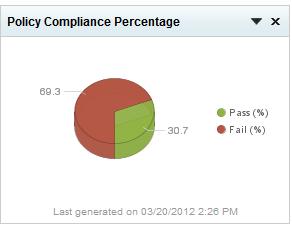
- The policies' compliance percentage.
A pie chart will show as of the last policy scan, what percentage of the assets that were tested with the policy passed and failed.
- The five most and least compliant assets.
The graph shows trending information on the assets that have been scanned within the last 90 days. It shows the compliance percentage over time and allows security professionals to see important facts, such as sudden drops of the compliance status of specific policies, or improvements that allow users to focus their compliance efforts on specific assets.
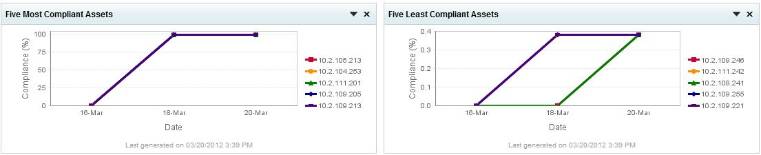
Users can use trending to see whether a particular event in their organization caused the drop in organizational compliance.
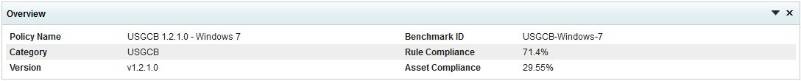
- An overview of the policy
Useful information associated with a particular policy, such as the name, category, benchmark, benchmark id, version, and, rule and asset compliance percentages.
- A Listing of rules that make up the policy.
Security professionals can also view all the rules that make up the policy and have a per rule breakdown of asset compliance.
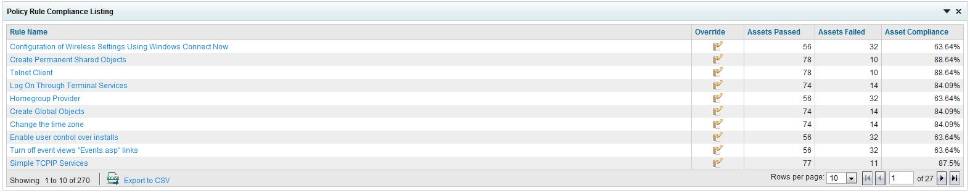
In this table users can create rule global overrides that will impact the current and future scan results. In the rule listing they can sort by asset compliance and understand which rules are the most and least compliant in their organization. Some of the key benefits include:
- Check which are the rules that are the most and least compliant, giving insight on which rules to focus compliance efforts first.
- Make decisions on whether the rule makes sense in an organization's specific environment or not.
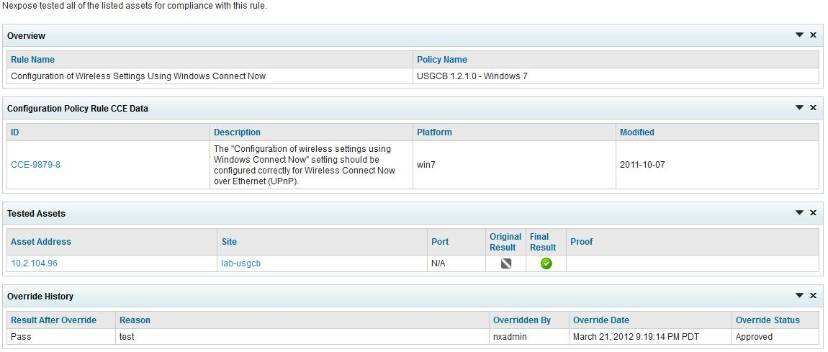
Example: let's take look at the Windows 7 policy in the context of USGCB: If users perform all of their troubleshooting operations through remote desktop in their organization, chances are that most of their assets will fail the Allow users to connect remotely using Remote Desktop Services rule. In this case security professionals may want to globally override the rule results because the rule does not make sense in their organization.
- A Listing of assets that were tested for compliance with the policy.
The list of assets and the test results are listed in this table making it really easy to understand and focus compliance efforts on the specific assets.
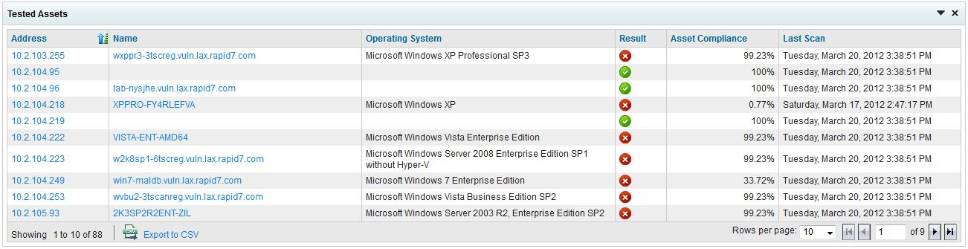
The tested assets table will also let users see which assets were tested for compliance, allows them to sort by result and focus on the assets which are failures. Security professionals will be able to sort on a lot of criteria, such as by operating system, asset IP, asset name, the date of the last scan among others. Users will also have the ability to export all of the assets' data to a CSV format.
The policy rule dashboard page
Like the policy dashboard, the policy rule dashboard helps organizations to better understand their compliance status with regards to a particular rule within a policy. Users will have the ability to drill down into one of the rules that make up the policies and visually see their organization's compliance status for that particular rule for each asset that has been tested with the policy. The policy rule dashboard allows users to know everything they need about a particular policy rule such as:
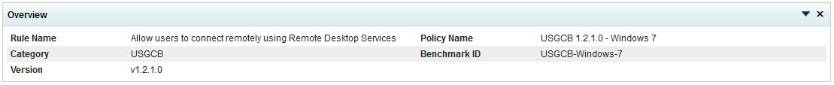
- An overview of the rule.
Useful information associated with a particular policy rule, such as the name, category, benchmark id, version, and the name of the policy that the rule belongs to.
- A Listing of assets that were tested for compliance with the policy rule.
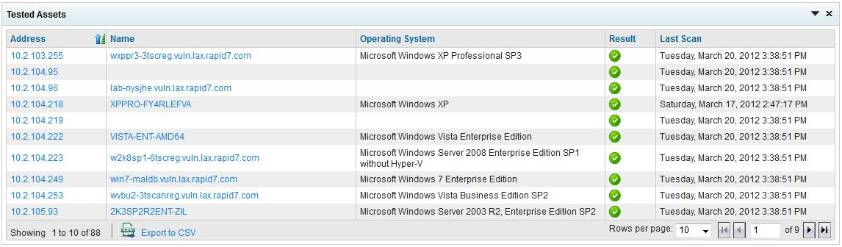
This table will allow security professionals to see only those assets that they ran the rule against, visualize the result, and also gives them the ability to drill down to the asset to get even more granular information of the test results(by clicking on the asset name or IP):
With these additional capabilities, organizations will find it much easier to track the most important activities happening in their environment as it relates to policy scanning. Stay tuned, there's more coming! We love our policy dashboards.