This guide is designed to show a few techniques to monitor how the Java Virtual Machine (JVM) memory is used. When Nexpose starts, it takes a 75% sized chunk of the available memory. The memory utilization graph of your system will just appear to flat-line.** But what does it really do with all that memory? Hopefully by the end of this guide you will have a better idea of what goes on under that line and be able to tweak your systems to maximum efficiency.**
How does memory usage work with the JVM?
Lets start with looking at the mem.log for a box with 8 GB of RAM:
  2012-10-22T17:10:13 [INFO] [Thread: Security Console] Initializing resource decision manager, detecting memory configuration:
  OS memory: 2900054016 free bytes out of 8391892992 total.
  Pool Code Cache (init=2.4 MB, used=7 MB, committed=7.1 MB, max=48 MB)
  Pool Par Eden Space    (init=6.5 MB, used=187.7 MB, committed=266.2 MB, max=266.2 MB)
  Pool Par Survivor Space (init=768 KB, used=0 bytes, committed=33.2 MB, max=33.2 MB)
  Pool CMS Old Gen        (init=248 MB, used=777.2 MB, committed=1.8 GB, max=5.5 GB)
  Pool CMS Perm Gen      (init=20.8 MB, used=45 MB, committed=73.2 MB, max=160 MB)
  2012-10-22T17:10:13 [INFO] [Thread: Security Console] Resource decision manager establishing memory thresholds:
  JVM Warning Threshold set at 5.4 GB out of 5.5 GB from Tenured Generation
  JVM Reaction Threshold set at 5.5 GB out of 5.5 GB from Tenured Generation
With 8 GB of RAM usually only a few hundred MBs are used by the OS. The JVM is going to take 75% of the remaining available memory which is roughly 5.6 GB (in this case).
If all of the 'max' values in the output above are added together, you will see this number. There are multiple good articles on what each of the memory types mean and do, but the primary memory type we will focus on is the 'Old Gen' memory.
The following section will look at 3 different solutions for inspecting the JVM as well as pros and cons for each:
** pros:**
- Can leave jstat running in the background and use the data at a later time without the need to monitor its progress
** cons:**
- Requires openjdk to be installed on the scanning engine
- No graphical interface
- Requires a spreadsheet tool to graph the results
** pros:**
- No required software needed, just some minor configuration and a service restart
- Graphical interface that shows memory usage in realtime
- Can be run remotely
** cons:**
- No way to log the output. Requires realtime monitoring
Solution 3 (jstatd & visualvm)
** pros:**
- Big virtual interface
- Track memory, threads and even CPU
- Very cool program to run
** cons:**
- JDKTools needs to be installed on both systems.
In Summary:
If you want to walk away during the memory monitoring process, use jstat, if you want a real-time solution without installing software on the Nexpose device use jconsole, and if you want a real-time verbose solution and don't mind installing the jdk on both systems use visualvm.
See below for how-to intructions on setting them up:
Solution 1 - using JStat
- sudo –i to get root. (root will help, but sudo should would for all commands)
2)sudo apt-get install openjdk-6-jdk
3)jps -l
- You will get output similar to the following:
    root@ENGINE1:~# jps -l
    6519
    913 sun.tools.jps.Jps
- A secondary way to check is the following:
    root@ENGINE1:`# ps -ef | grep nexserv
    root    6519  3582  6 16:39 pts/1    00:17:28 ./.DLLCACHE/nexserv -className=com/rapid7/nexpose/nsc/NSC
    root    20407 20016  0 21:04 pts/3    00:00:00 grep --color=auto nexserv
- You want to pick the number with nothing after it as highlighted or that corresponds to the .DLLCACHE/nexserv. (6519 in this example)
- Then run the following command:
nohup jstat -gc 6519 15s >> /opt/jstat15sec-11-06 &
Note: the above output file name (jstat15sec-11-06) is just an example.
Note: The (15s) will kick off the command to run on the specified pid number and it will refresh every 15 seconds. (The lower the number, the more available data-points to graph.)
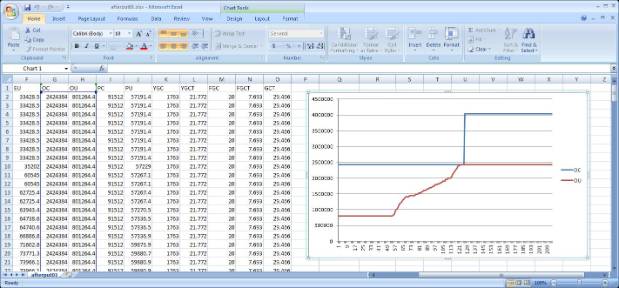
5) Once the scan cycle is finished, transfer the output file to a Windows box, import as a txt file into Excel with a ‘space' delimiter for columns. Do some minor tweaks, highlight the data and pick a graph that works. Standard ‘Line' graph is usually optimal.
This will let you see all the different memory types and have a much better idea of how the JVM memory is being utilized during the scan. This solution is best if you want to set it up and work on something else (run in the background and log unattended). The next couple solutions are more about real-time monitoring.
Solution 2 - using JConsole
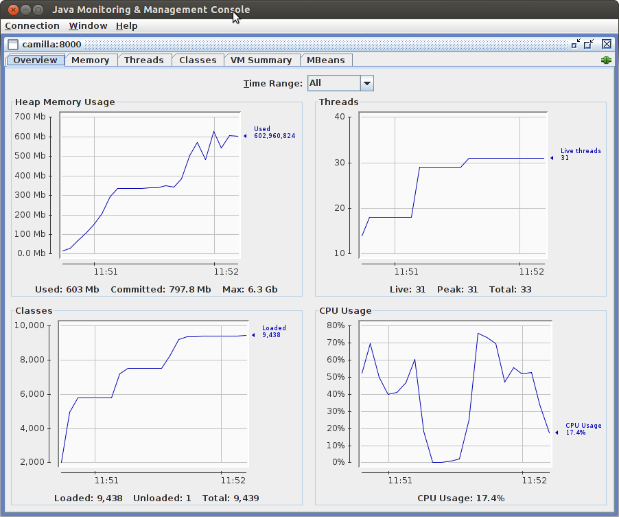
Run JConsole
- You will need to have an openjdk install on the system used to monitor the console. (Generally the same box used to log into Nexpose via the Web Console from)
- If the Java bin directory is already in the bin path, then you can just type jconsole and the GUI will pop up. Otherwise you have to navigate to the java bin directory and execute it from there.
Connect to a remote machine (the server that Nexpose is installed on)
- Use SSH or Putty
1) On Linux verify that the hosts file of the targeted machine contains an entry for the target machine itself.
- For example
10.2.22.162    nexposeappliance  ---> Correct
#127.0.1.1    nexposeappliance  ---> Incorrect
- Edit the NexposeEnvironment.env file. Add these entries into the environment file and then save and restart the service for the engine or console:
 -Dcom.sun.management.jmxremote.port=8000
    -Dcom.sun.management.jmxremote.authenticate=false
    -Dcom.sun.management.jmxremote.ssl=false
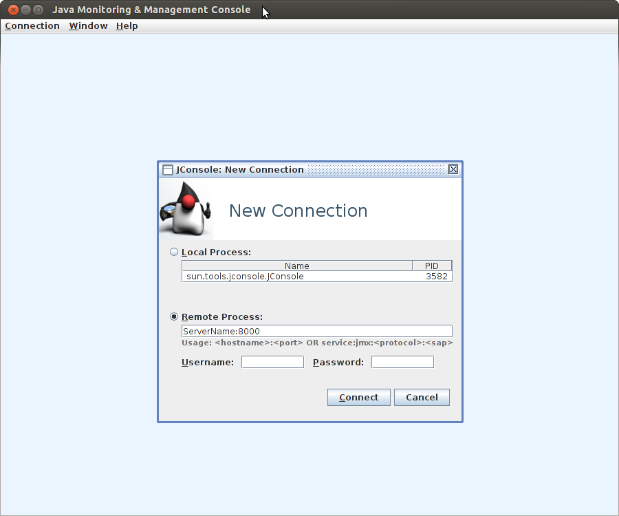
- Start Jconsole, select 'remote process', and specify the IP and port. For example ---> 10.2.22.162:8000 and then connect.
- Leave the user and password blank (you can add security as well, but we can discuss that with a future post)
Solution 3 - using JStatd & VisualVM
On the console or engine server as well as your local box run the following command to install the jdk:
sudo apt-get install openjdk-6-jdk
On the console or engine server run the following two commands (this will perform the necessary file changes and start the jstatd listener service on the device you want to monitor):
echo 'grant codebase "file:${java.home}/../lib/tools.jar" { permission java.security.AllPermission;};'>> /opt/rapid7/jstatd.all.policy

nohup jstatd -J-Djava.security.policy=/opt/rapid7/jstatd.all.policy &
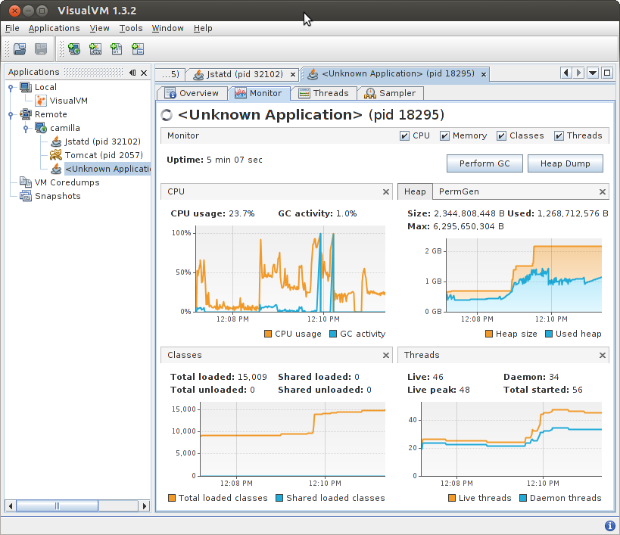
The openJDK installed above will have the VisualVM software needed. Run the following command to start it up:
jvisualvm
Doubleclick on Remote and put in the server name or IP (by default it is already configured to use port 1099). Once connected you will need to select the Nexpose instance to see the JVM stats. Once connected, visualvm has a bunch of awesome features that can be explored.
Most of the above steps should be easily translated into a Windows install. If you run into any issues with that let me know. Also, please post any other ideas or comments as we are all looking for ways to better optimize our environments!