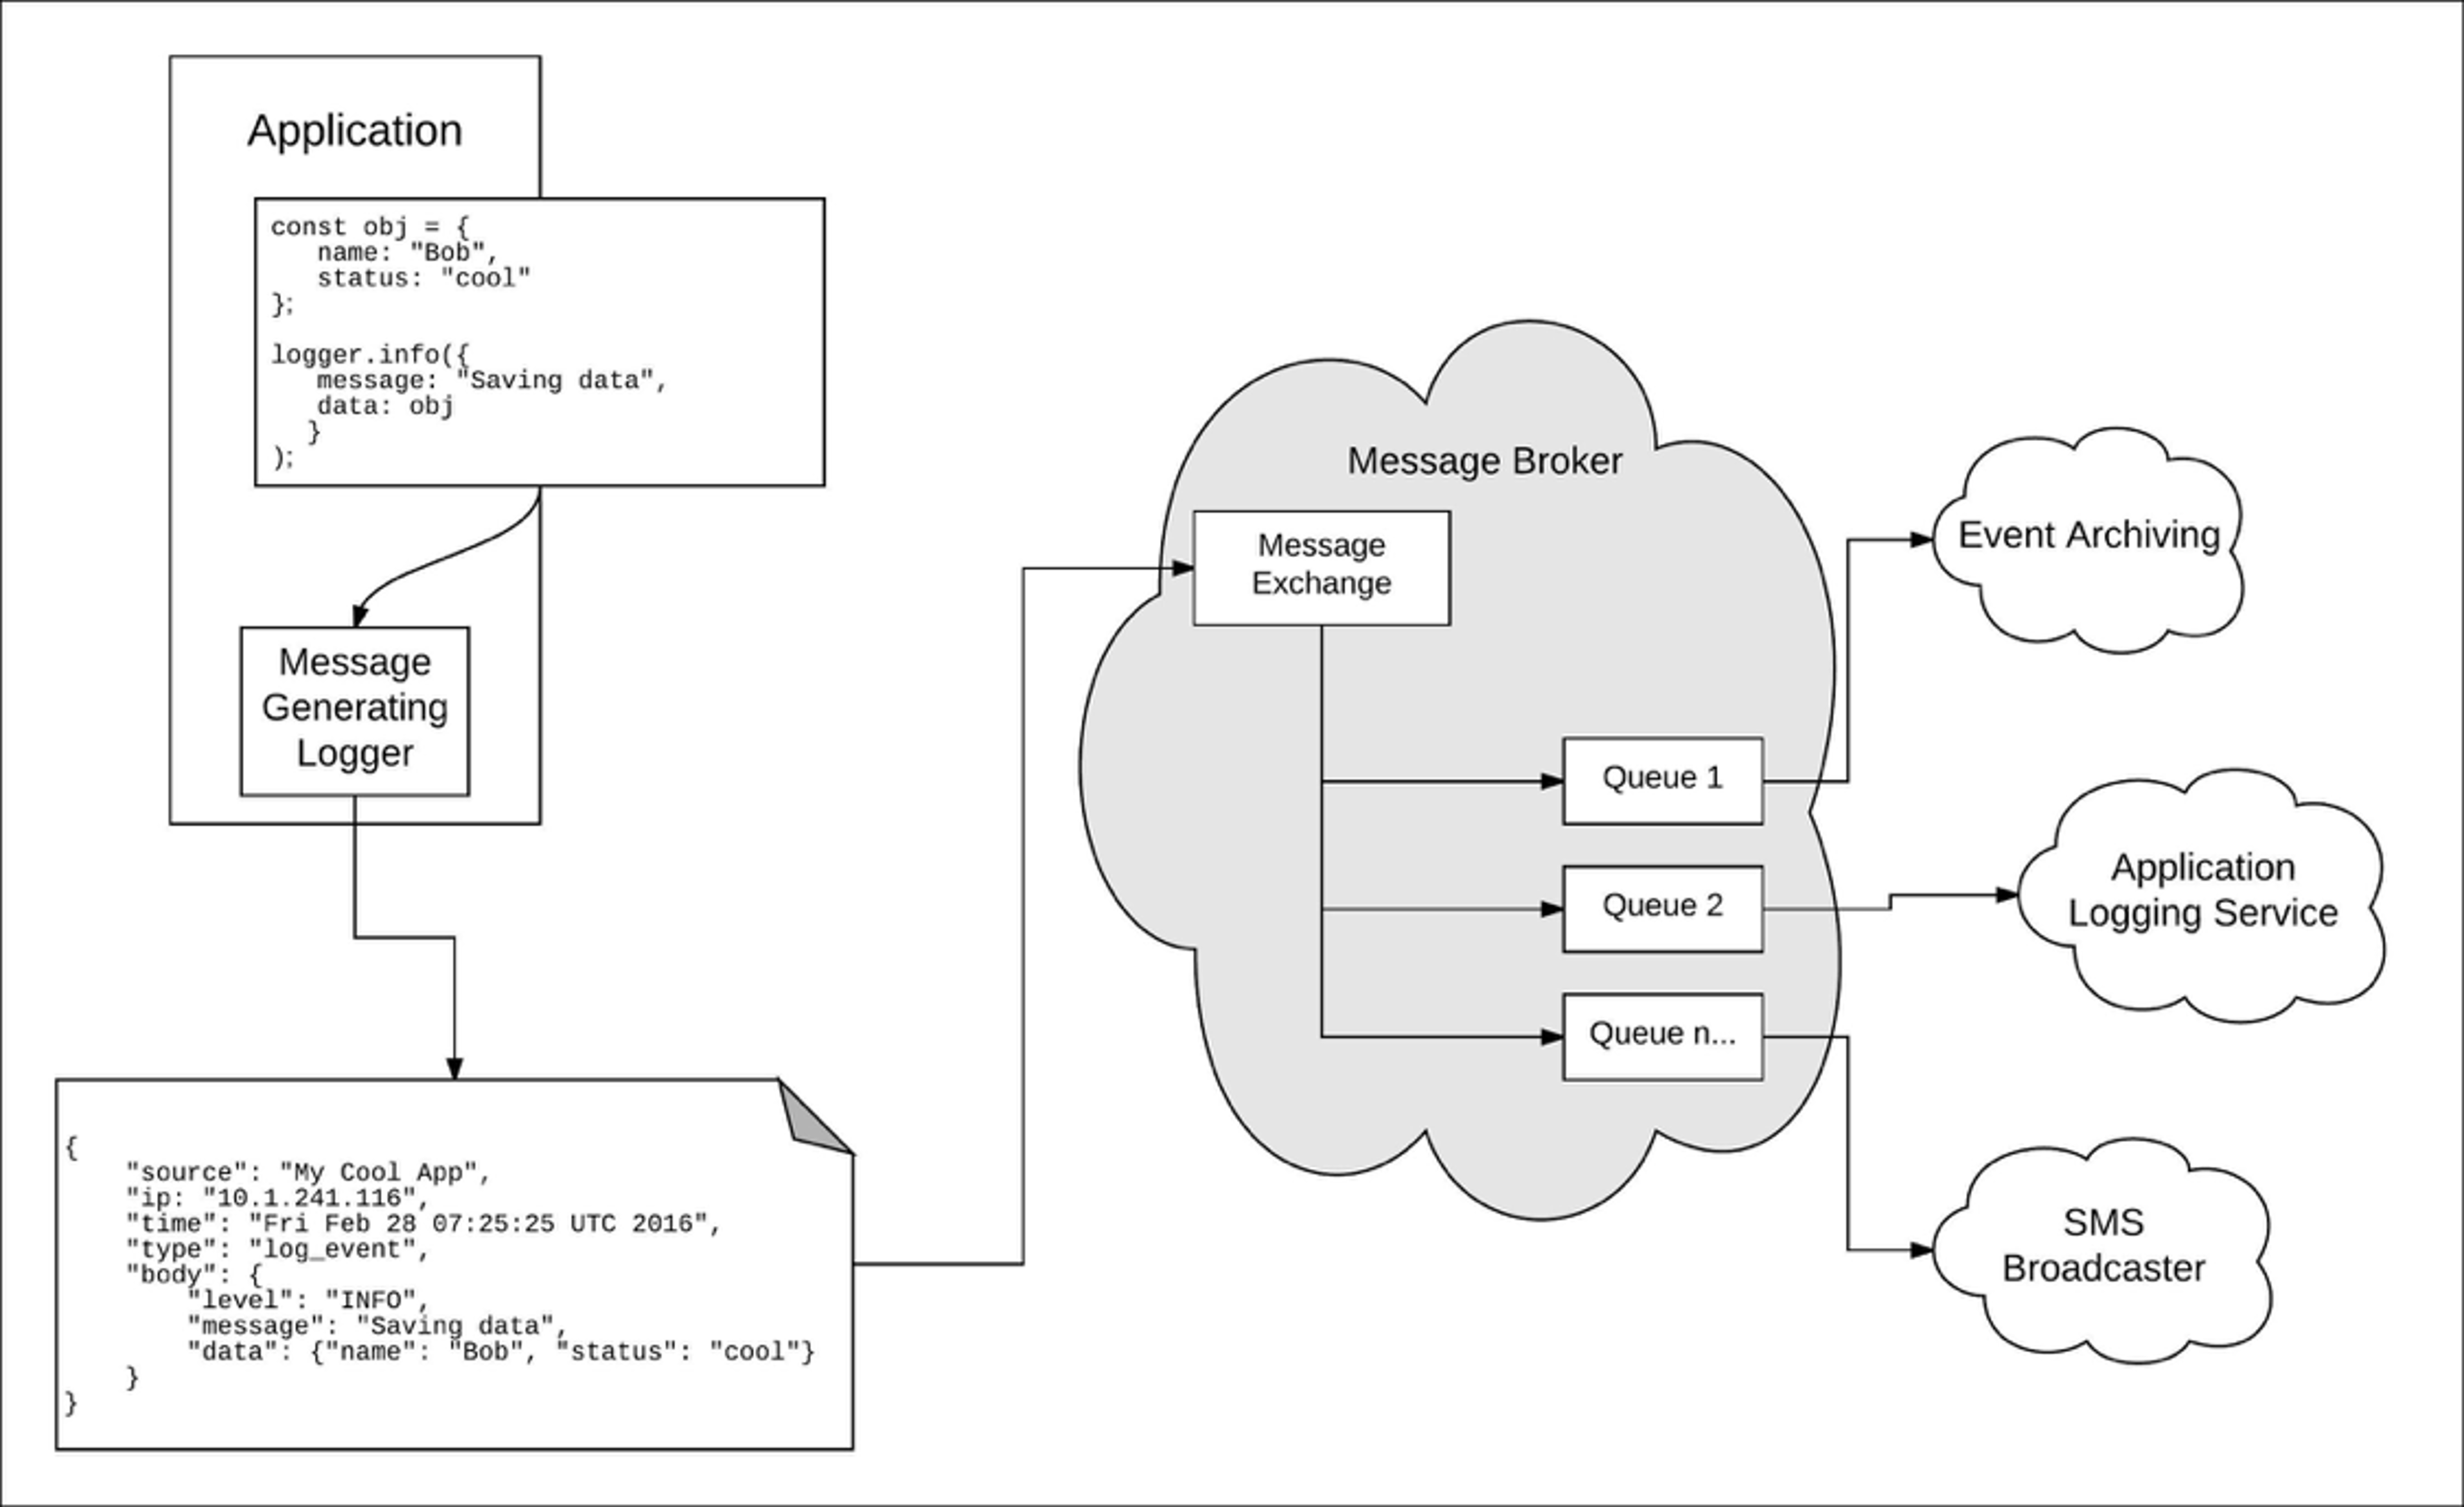
I’m often asked on calls with our customers what is the preferred format for log data being sent to Logentries. While we pride ourselves on being the Log Management tool that is easiest to setup and use, some very important advanced features of the platform are available for logs that are formatted into Key Value Pair (KVP) or JSON. Most applications and programing languages have the ability to change their logging format. With a little bit of work, you can unlock the full potential of our advanced search functions. Below we’ll discuss configuring Apache and Nginx both to send JSON formatted logs and how to take advantage of the search functions, sharable dashboards, and reporting capabilities within the Logentries platform.
Apache
Within Apache2, the default format of the access and error log looks like this:
127.0.0.1 - - [11/Aug/2014:16:44:00 +0000] "GET / HTTP/1.0" 200 11783 "-" "ApacheBench/2.3"
This log entry definitely contains some very important information. But by spending only 5 minutes configuring Apache, the logging information will contain a lot more useful information.
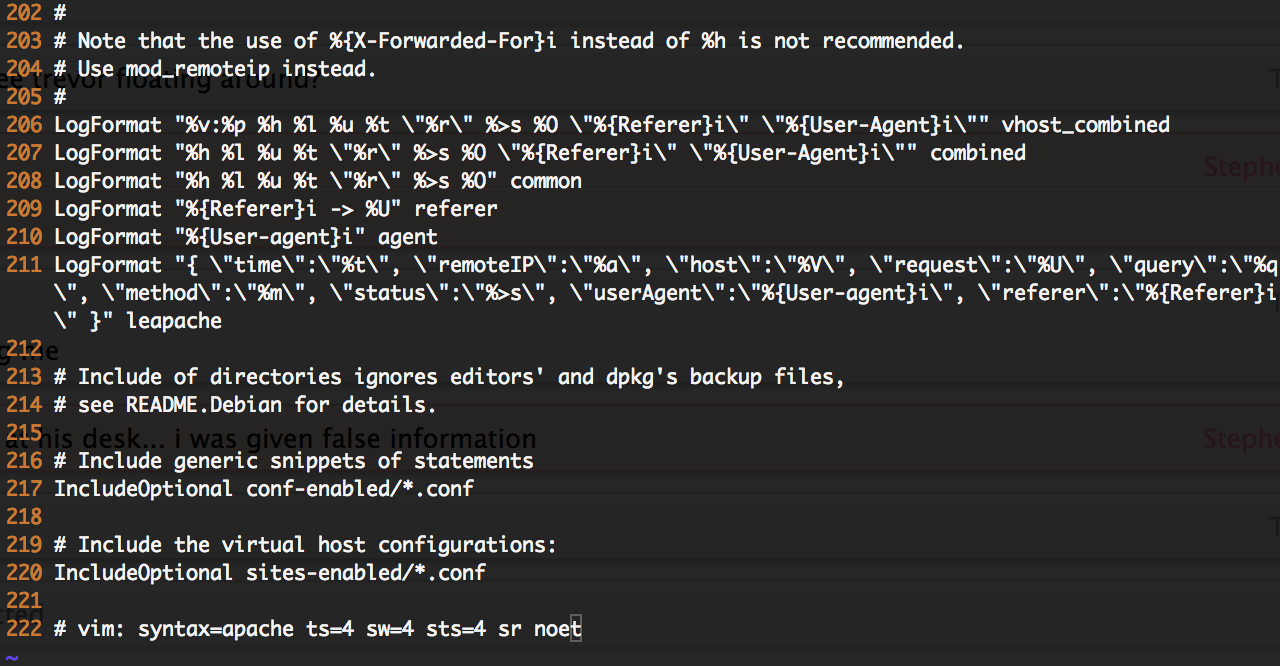
Start out by editing the apache2.conf file for your site/server found in /etc/apache2. Add the following line of code to your LogFormat area (see screen shot below).
LogFormat "{ \"time\":\"%t\", \"remoteIP\":\"%a\", \"host\":\"%V\", \"request\":\"%U\", \"query\":\"%q\", \"method\":\"%m\", \"status\":\"%>s\", \"userAgent\":\"%{User-agent}i\", \"referer\":\"%{Referer}i\" }" leapache
 Once this is configured, you now need to edit the default.conf for each site within your Apache configuration. In this case, we want to change the log type of access.log to leapache. For instance:
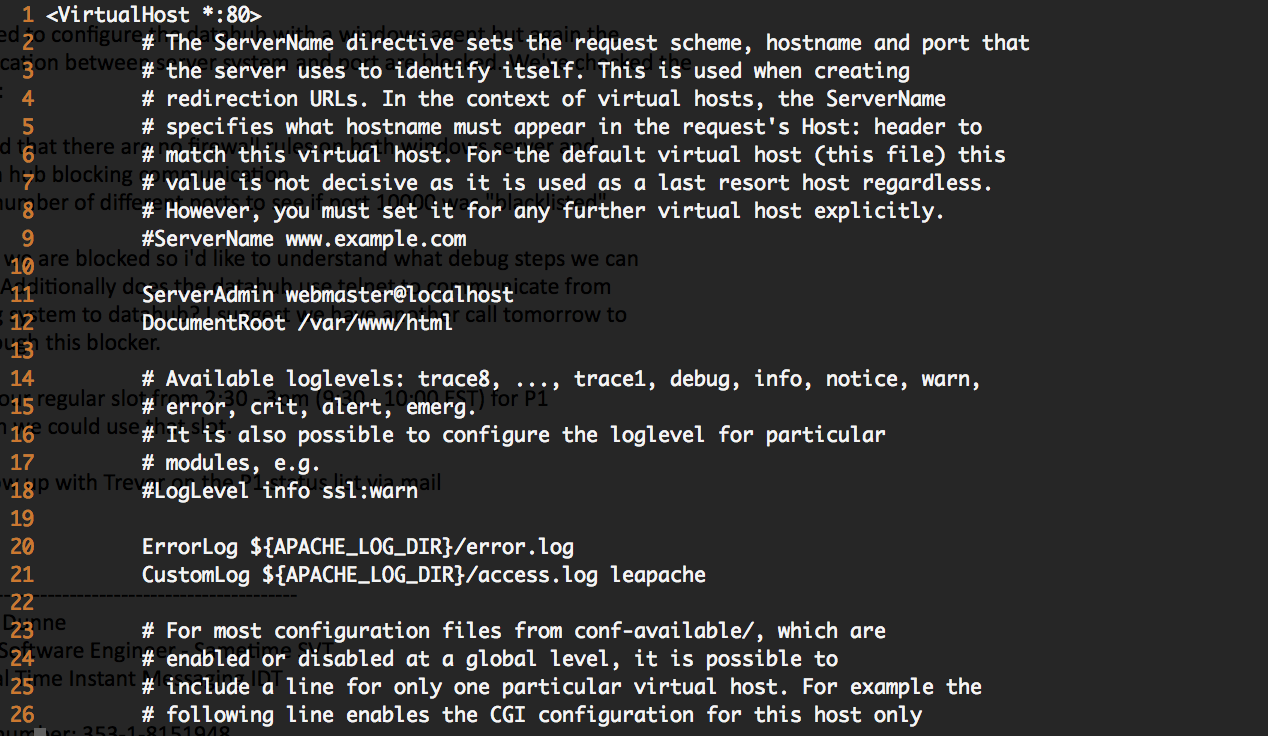
Once complete, restart Apache and now logging will look like this:
{ "time":"[11/Aug/2014:17:21:45 +0000]", "remoteIP":"127.0.0.1", "host":"localhost", "request":"/index.html", "query":"", "method":"GET", "status":"200", "userAgent":"ApacheBench/2.3", "referer":"-" }
Nginx
The Nginx configuration is almost exactly the same as the Apache2 configuration. To configure Nginx to log in JSON format, add the following lines to the #Logging Settings section of your nginx.conf (usually found in /etc/nginx).
log_format le_json '{ "time": "$time_iso8601", ' '"remote_addr": "$remote_addr", ' '"remote_user": "$remote_user", ' '"body_bytes_sent": "$body_bytes_sent", ' '"request_time": "$request_time", ' '"status": "$status", ' '"request": "$request", ' '"request_method": "$request_method", ' '"http_referrer": "$http_referer", ' '"http_user_agent": "$http_user_agent" }'; access_log /var/log/nginx/access.log le_json;
Restart Nginx and your logging will now be in JSON format. The log entries will now look like this:
"time": "2014-08-11T11:40:13+00:00", "remote_addr": "122.226.223.69", "remote_user": "-", "body_bytes_sent": "579", "request_time": "0.000", "status": "404", "request": "GET http://www.k2proxy.com//hello.html HTTP/1.1", "request_method": "GET", "http_referrer": "-", "http_user_agent": "Mozilla/4.0 (compatible; MSIE 7.0; Windows NT 6.1; WOW64; Trident/6.0; SLCC2; .NET CLR 2.0.50727; .NET CLR 3.5.30729; .NET CLR 3.0.30729; Media Center PC 6.0; .NET4.0C; .NET4.0E)"
Search and Functions in Logentries
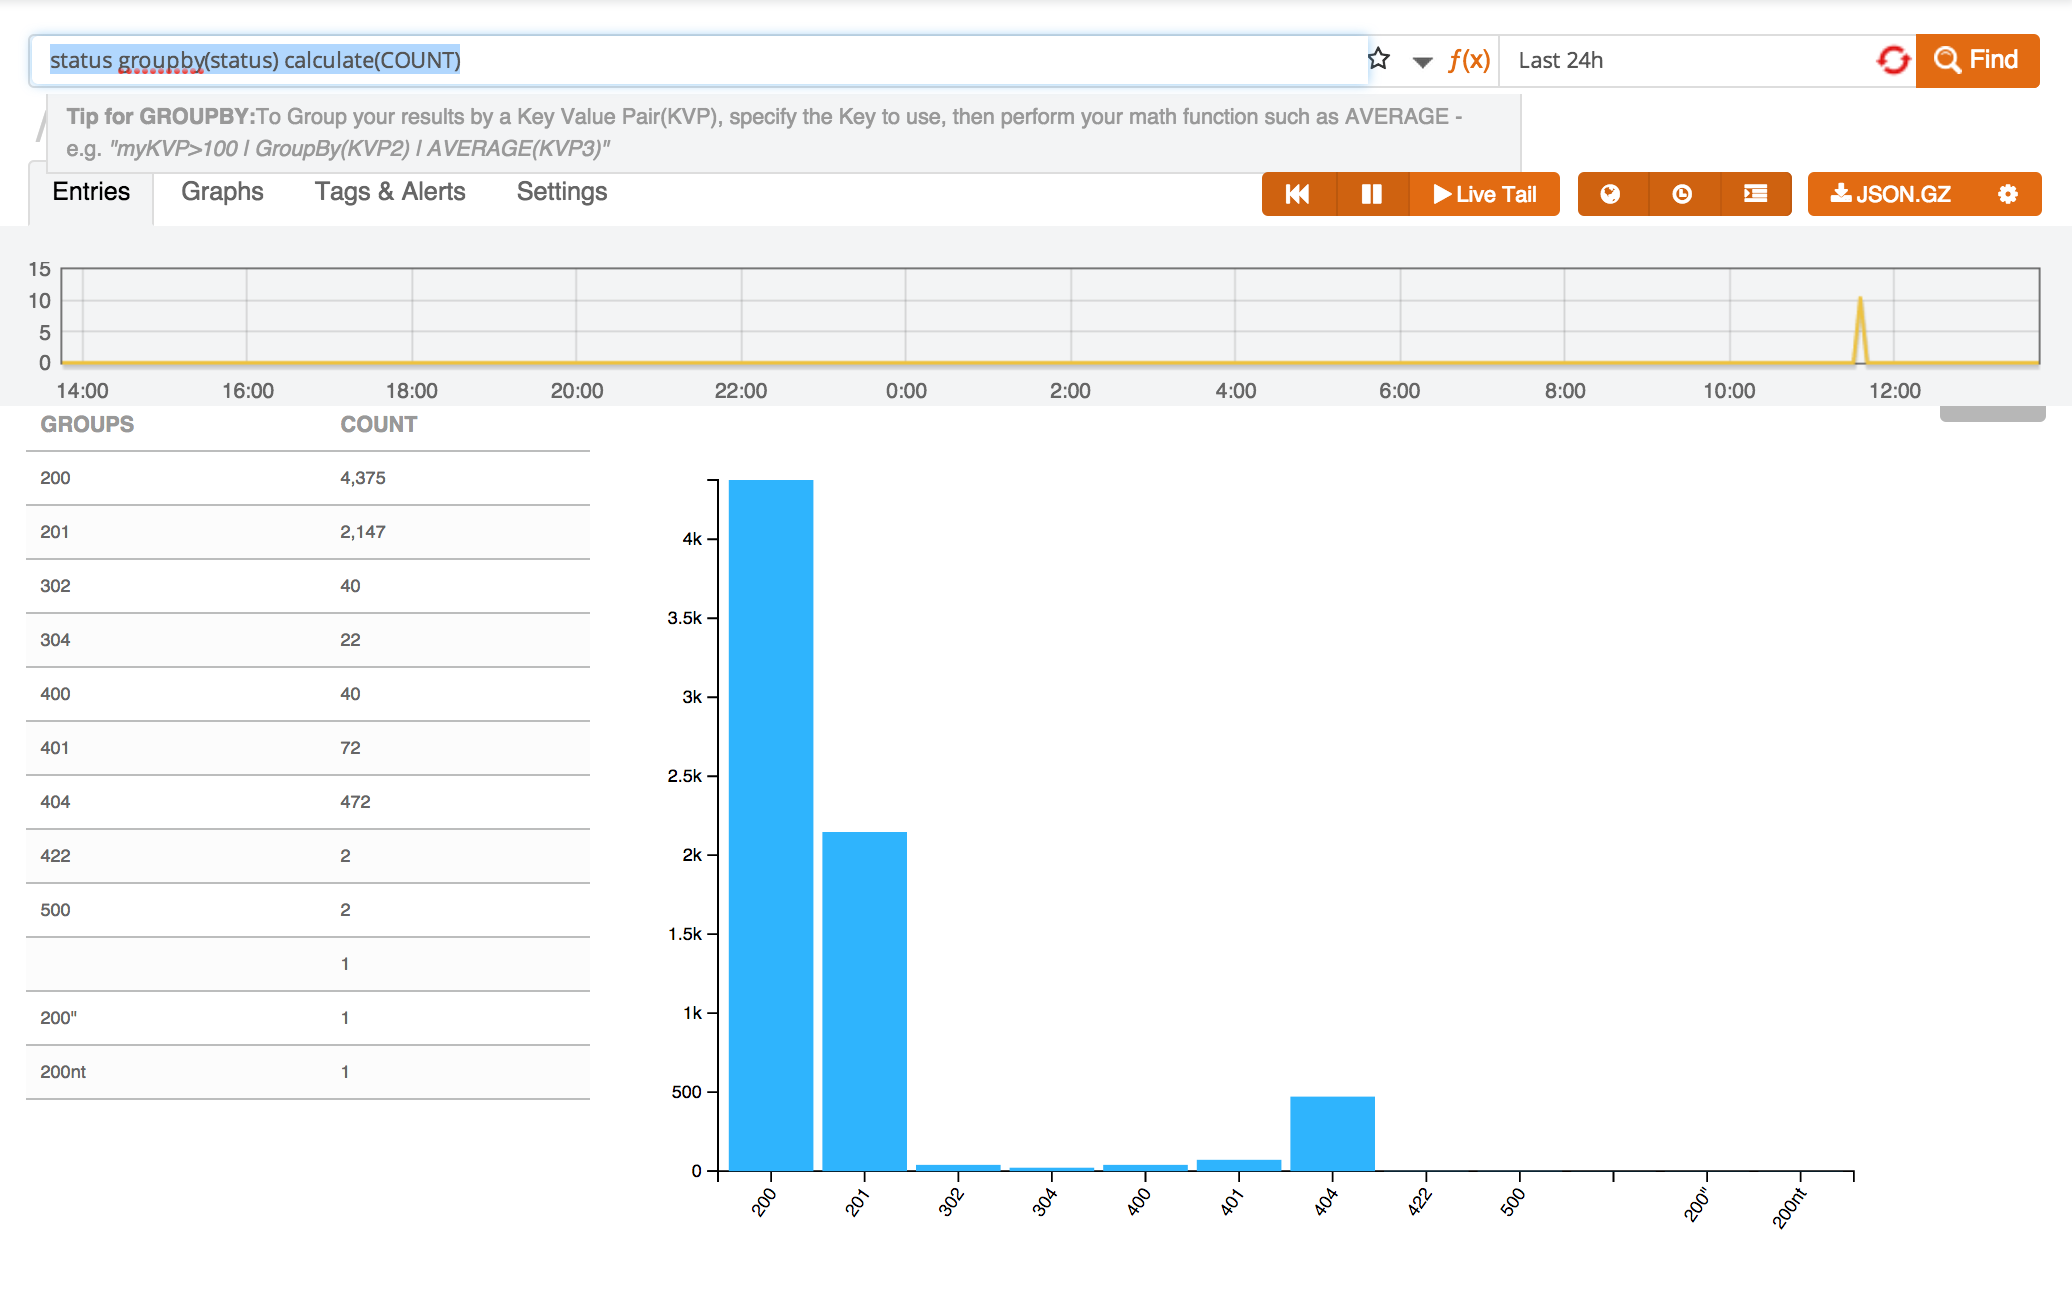
Now that we have our logs formatted in a more machine-readable format, we can get to the fun part! Start out by sending these logs to Logentries if you’re not already. Login to your account and access the logs within the UI. Try typing the following search into the search bar:
status groupby(status) calculate(COUNT)
This will result in a graph being created, showing you the status distribution over the period of time selected.
Other search functions are available as well:
Count: Produces a graph and chart of a count of all instances of the search term over the provided time. (e.g., status =200 calculate(COUNT))
SUM: Produces a graph and chart that sums all instances of the search term over the provided time. (e.g., bytes_sent>0 calculate(SUM))
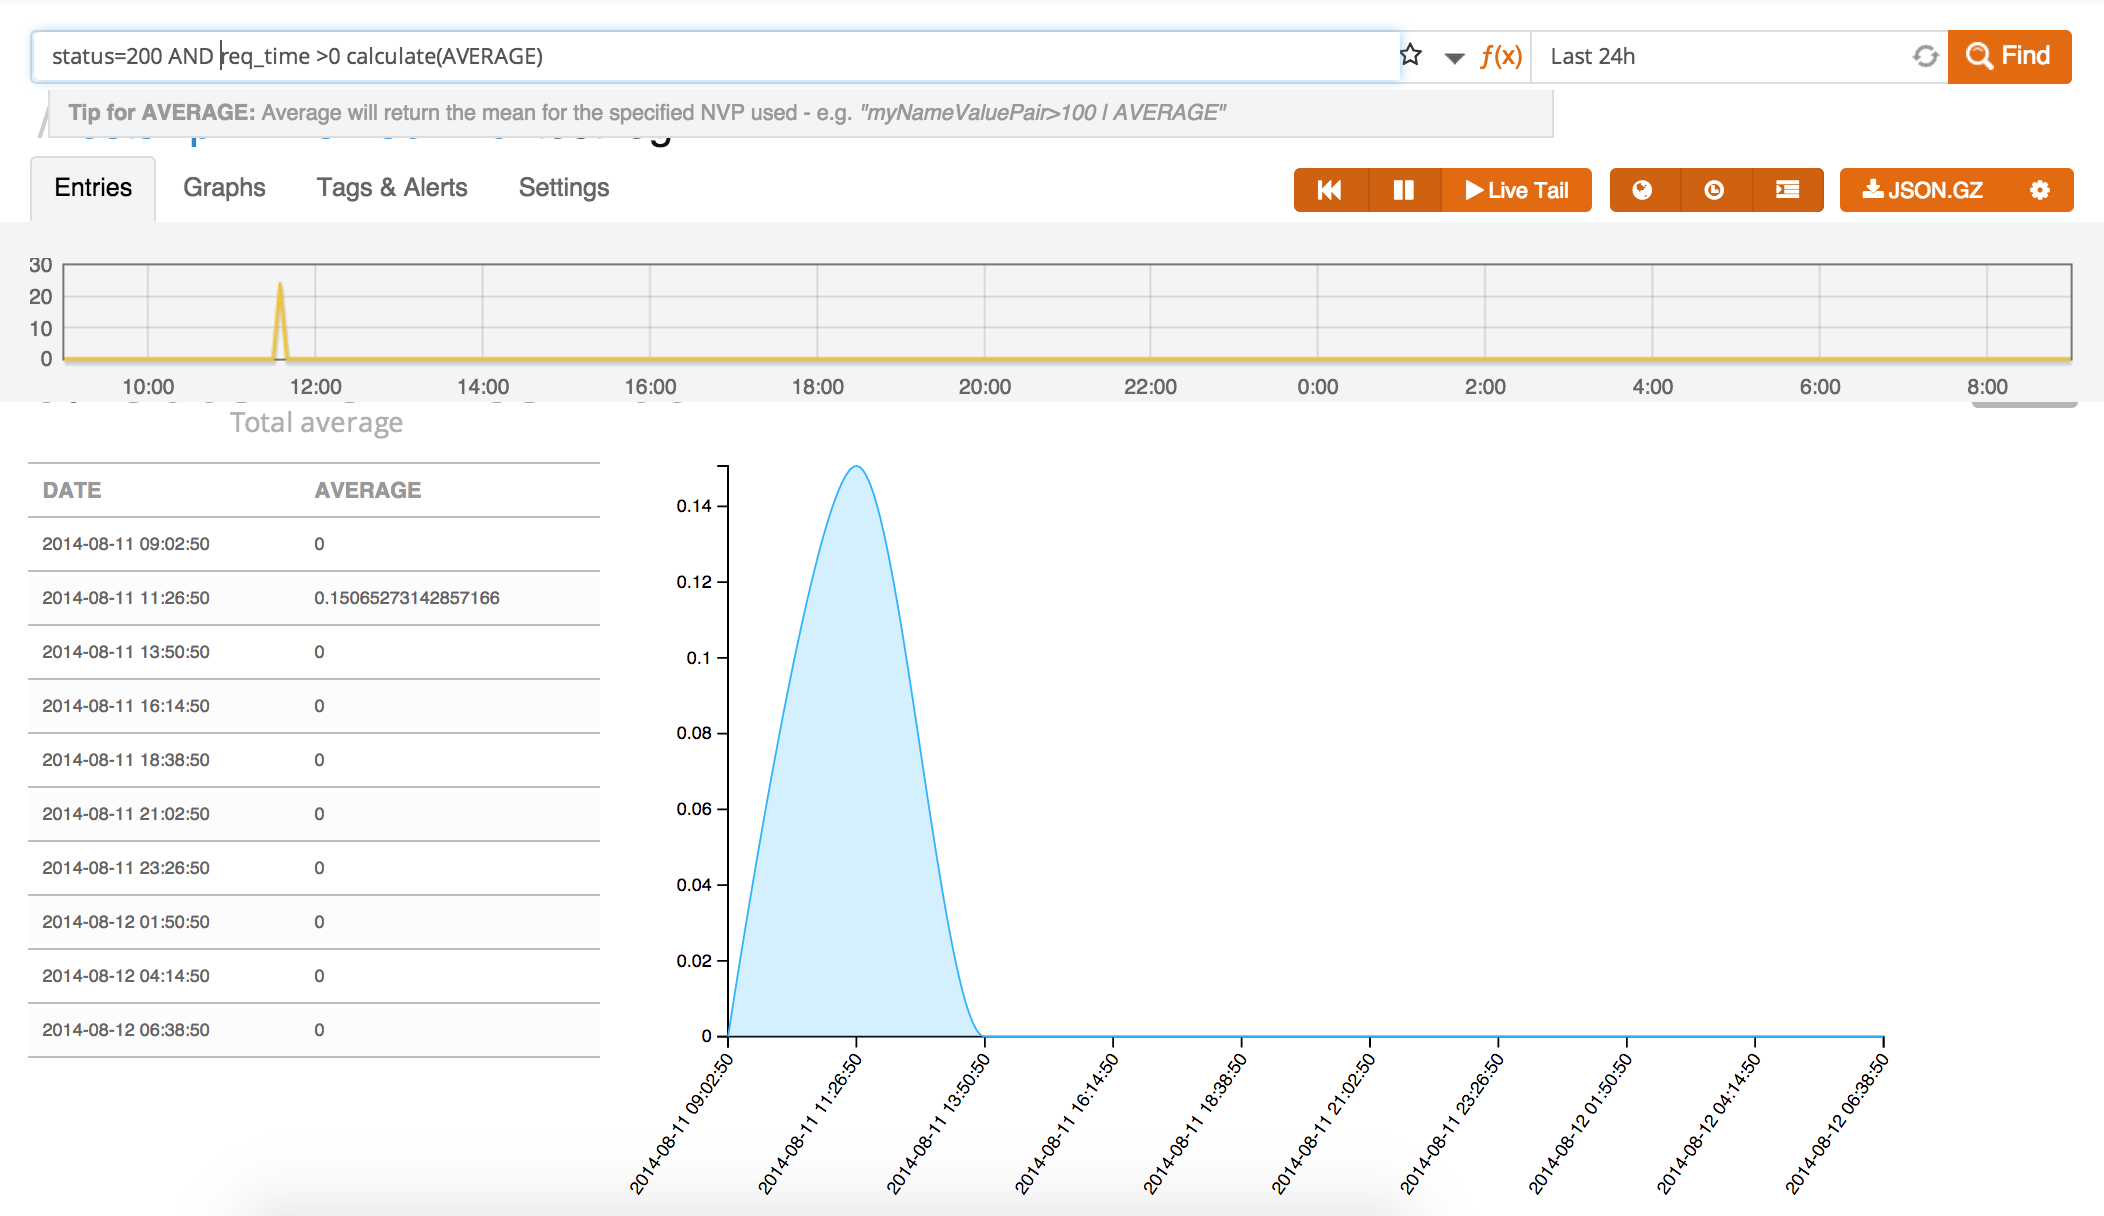
Average: Produces a graph and chart (below) that averages out the KVP item you’re searching for over the provided time. (e.g., req_time >0 calculate(AVERAGE))
 Count Unique: Gives you a view of unique log lines of your KVP item over the provided time. (e.g., status=200 calculate(UNIQUE:ip))
These searches can be saved as either a saved search and turned into graphs or a Tag to be alerted on at a later time. Using all that we’ve learned through the search functions, creating shareable dashboards, and sharing information to third party tools such as Geckoboard, you can now easily view, share, and analyze your logs like never before!
Ready to start getting insights from your applications? Sign up for a Logentries free trial today.