
MongoDB 3.0 is now available! If you are new to MongoDB or upgrading from 2.6, you will enjoy all of the new features including document-level locking, better write performance, big memory support, and more. Additionally, to improve usability of the log messages for diagnosis, MongoDB now categorizes some log messages under specific components, operations, and provides the ability to set the verbosity level for these components.
Today, Logentries is launching a new Community Pack for MongoDB 3.0 to help users get even more value from the new logging capabilities.
The Community Pack includes pre-built saved searches, tags and dashboards to enables users to quickly collect and analyze important MongoDB logs. And, we did not forget about version 2.6 users. We are excited to offer two Community Packs to support both versions of this cross-platform document-oriented database.
Let’s see how the log message structure changed in the new release.
Mongo 2.6 Log Message Structure
<timestamp> [<context>] <message>
2015-03-22T15:11:25.939+0000 [conn2] command test.$cmd command: insert { insert: "cars", documents: [ { _id: 3.0, user: "mercedes", status: "A" } ] } keyUpdates:0 numYields:0 locks(micros) w:78 reslen:40 2ms`
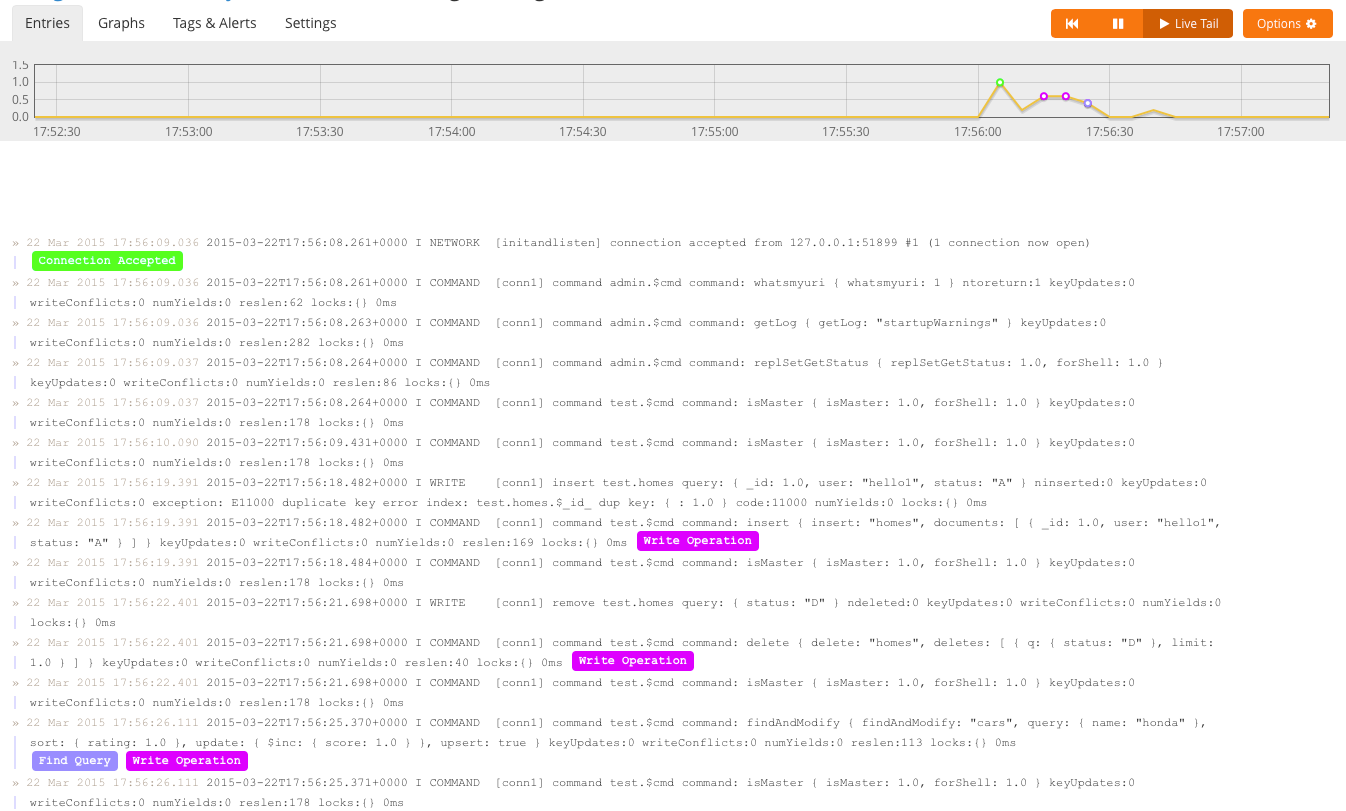
Mongo 3.0 Log Message Structure
<severity> <component> [<context>] <message>
2015-03-22T15:11:25.939+0000 I COMMAND [conn1] command test.$cmd command: insert { insert: "cars", documents: [ { _id: 3.0, user: "mercedes", status: "A" } ] } keyUpdates:0 numYields:0 locks(micros) w:78 reslen:40 2ms
The user of MongoDB has to remember that a single log event characterizes the performance and efficiency of a single operation, and only indicate that the operation was poorly performnig or inefficient. To get a bigger picture and see if the database is being overwhelmed with many of these bad operations, one might want to use Logentries Dashboards.
How to Forward Your MongoDB Logs to Your Logentries Account?
Install Logentries Agent on your machine and follow the logs saved in your MongoDB log directory. By default, you can find mongo logs in /var/log/mongodb, however when used with the* –logpath* option or systemLog.path setting, mongod and mongos instances report a live account of all activity and operations to a log file of users choice. MongoDB’s standard log rotation approach archives the current log file and starts a new one.
mongod -v --logpath /var/log/mongodb/WriteLogsHere.log
Pre-installed Tags and Alerts
Determining the state and health of the server involves analyzing what is happening in the log over a interval of time, rather any one log event.
However, there are some log lines we look for, which indicate problems. This is when alert tags become very useful to the user.
MongoDB Community Pack comes with out-of-the-box tags and alerts to assist you with your database activity analytics
Tagging examples:
- There is a warning message that is emitted when a journal flush would exceed 256 Mb. Each write operation in MongoDB is written to the journal file before being itself flushed to disk. We then create an alert tag to catch this event and report to you immediately.
- Similarly, playing around with MongoDB logs we came across an error message “RS102 too stale to catch up“. This log line means his node fell behind so far in replication that it will never catch up and will require a full resync. This happens when the node lags further and further behind in replication until it looses its comon point in its oploc and with the primary’s oplog. This situation is often caused by an insufficiently sized oplog and the admin should consider increasing the size oplog. Once again, MongoDB Community Pack has this covered in a collection of pre-defined tags.
- From time to time, we might observe a log event indicating the overload of the node, which becomes unresponsive with time. The user is able to set an alert, whenever this event is found.
Dashboard
Every professional that works with databases such as a programmer, a database administrator, a system administrator or an analyst should have the ability to solve unexpected problems that appears during a normal day at work. Even if you’re just an amateur, student or hobbyist working on a project involving Mongo Database, it’s a good idea to monitor the activity in a professional manner. MongoDB Community pack delivers extensive log analytics in the form of pre-defined graphs and charts.
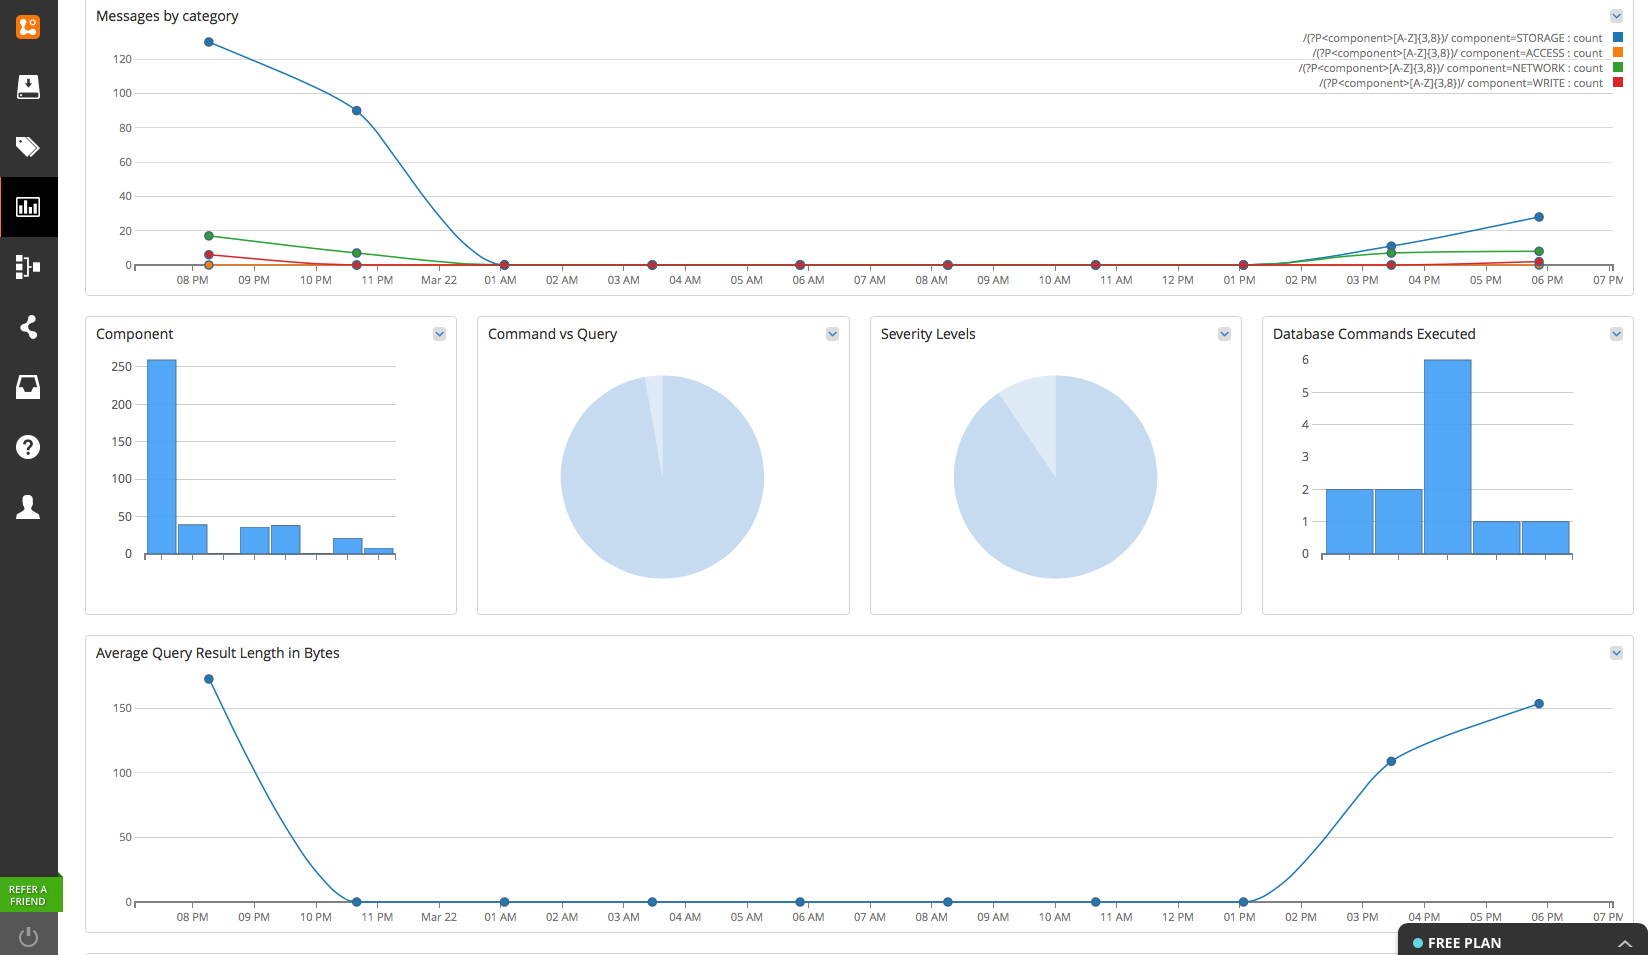
Pre-installed graphs and charts in MongoDB Community Pack
The user is able to graph the distribution of components, database commands, severity levels, average query result lengths and many more. This Community Pack takes an advantage of new fields (mentioned at the start) included in the log message.
Severity Levels
There are 5 Severity Levels, which user can observe in a pie chart pre-installed in the pack.
- F– Fatal
- E – Error
- W – Warning
- I – Informational, for verbosity level of 0
- D – Debug, for all verbosity levels > 0
The user is able to specify the verbosity level of various components to determine the amount of informational and debug messages MongoDB outputs.
Components
Log messages now include components, providing functional categorization of messages
- ACCESS
- COMMAND
- CONTROL
- GEO
- INDEX
- NETWORK
- QUERY
- REPL
- SHARDING
- STORAGE
- JOURNAL
- WRITE
The pack includes saved searches for all of the above to make it easy to identify and troubleshoot log events. Finally, there are two packs available here. Make sure you download the right pack for your version of MongoDB.