This guest blog post is written by Matthew Skelton, Co-founder and Principal Consultant at Skelton Thatcher Consulting.
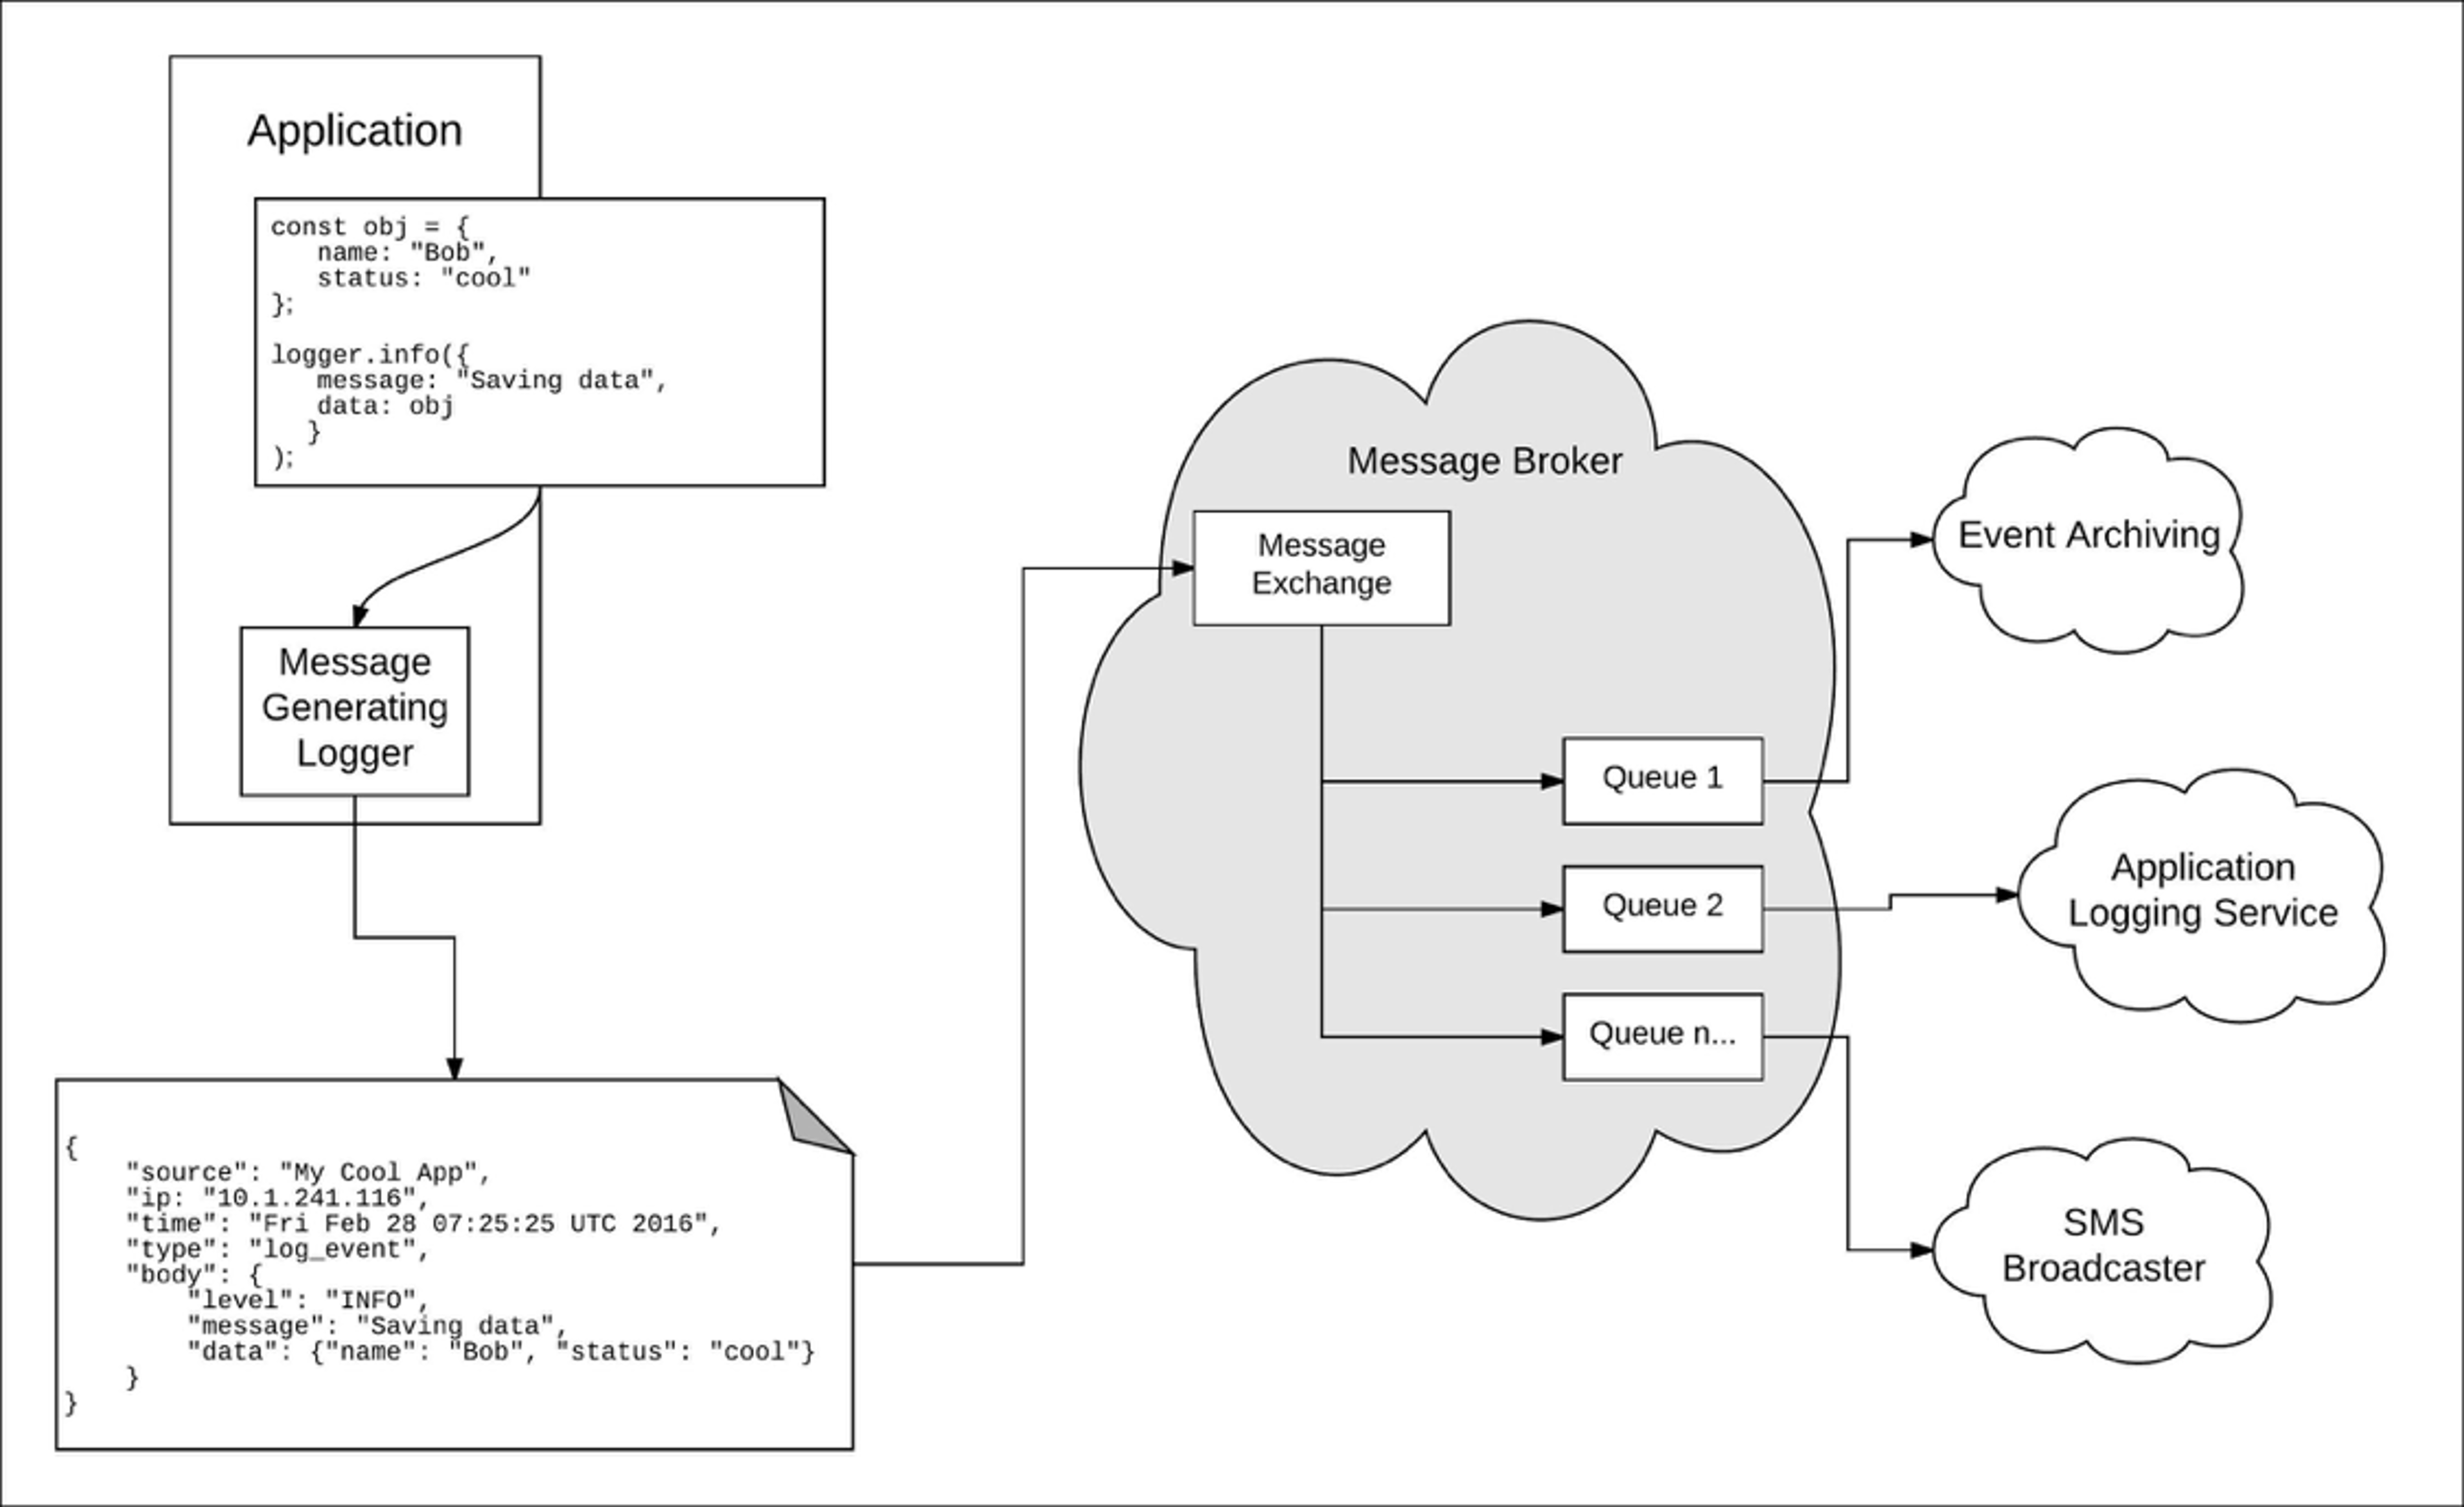
Summary: As a Developer, you cannot attach the debugger to your application in Production, but you can use logging in a way that helps you easily diagnose problems in both development AND Production. You also get to make friends with Operations people – win! The applications we’re developing and running are becoming increasingly distributed, with requests crossing several service or container boundaries. The traditional debugger is of limited use in these scenarios, but with a solid, easy-to-use log aggregation capability in place, we can begin to explore ways of using logging to improve our understanding of how the software behaves in Production and enhance our ability to diagnose problems rapidly. Logging becomes not just a ‘dump’ of exception or error details, but a rich trace of application execution.
 There are three key parts to this modern approach to logging: - Event type IDs
- Configurable log severity levels
- Transaction tracing
We’ll now look at each of these facets in turn.
Event type IDs
Event type IDs are values that represent specific application states, typically based on an enum. Each application state has its own ID, unique to that application (or suite of applications). Event types include both technical and domain events, so we might define a set of Event type IDs like this:
public enum EventID { // Badly-initialised logging data NotSet = 0, // An unrecognised event has occurred UnexpectedError = 10000, ApplicationStarted = 20000, ApplicationShutdownNoticeReceived = 20001, PageGenerationStarted = 30000, PageGenerationCompleted = 30001, MessageQueued = 40000, MessagePeeked = 40001, ItemAddedToBasket = 60001, ItemRemovedFromBasket = 60002, CreditCardDetailsSubmitted = 70001, // ... }
We use an enum because we can represent application states with both human-readable memorable values (like ApplicationStarted) and integer values (like 20000), and enums (generally) allow a sparse numbering scheme, with gaps between blocks of IDs. This means we can represent all application startup/shutdown states with (say) event IDs 20000-29999 – with over 4 billion integers in a typical enum space, we are unlikely to run out of IDs! Any and every ‘interesting’ application state is captured with a call to the logging subsystem, passing in the event type ID (for instance, ApplicationStarted or 20001):
logger.Message(EventID.ApplicationStarted, ... );
This means we can search easily for specific application states (using the exact event type) but also groups of application state, such as “Message”* to find MessageQueued, MessagePeeked, and so on, assuming we name the enum values consistently.
Configurable log severity levels
One thing I have always found baffling when writing application code is the need to specify the log severity level at the point where the log call is made. As a developer, why should I be forced to make a decision about log severity before the application is run? Surely log severity is dependent on context, or might need to change after deployment? It turns out to be pretty straightforward to decouple log severity levels from log events, and it’s something I have been doing for many years. We store the severity level for each event type ID in configuration, and do a severity lookup when a log call is made. Here is some example severity configuration in JSON:
{ "eventmappings": { "events": { "event": [ { "id": "CacheServiceStarted", "severity": { "level": "Information" } }, { "id": "PageCachePurged", "severity": { "level": "Debug" }, "state": { "enabled": false } }, { "id": "DatabaseConnectionTimeOut", "severity": { "level": "Error" } } ] } } }
When we come to log an event, we simply provide the event type ID and the message, and the underlying logging setup does the severity mapping:
DecoupledLogger.Log(EventID.PageCachePurged, "details");
In this case, our logging subsystem looks up the severity for PageCachePurged and finds it to be ‘Debug’; however, it also sees that logging for this entire event type ID has been disabled (enabled: false) so no message is logged at all. This is great for tuning log events after deployment; we do not need to recompile our code, and different environments can have different severity levels if we want (useful for things like Performance testing, where we care about specific events).
Transaction tracing
With applications becoming more distributed, we need to be able to trace the logical execution of a single request or callback across service and component boundaries. A simple and effective way to do this is with a transaction trace (or correlation) ID which we inject at the start of the request, and then log at each component. The ID needs to be ‘unique enough’ for the time window we’re likely to consider, so although a UUID/GUID would work, such an ID is probably too long and certainly is too tricky to type into a search dialog. When we search for the ID, we can be sure that every log entry containing that ID (within that past say 15 minutes) represents part of the original, traced request, allowing us to reconstruct the request ‘after the fact’ – very useful for both developers and operations people!
Enable Learning and Collaboration Through Logging
Application Performance Management (APM) can be great when used effectively; the insights into application performance can mean the difference between fixing a performance problem and having to scale out the number of VMs to cope with increased load. However, if APM is used only in the Production/Live system and not in upstream environments (due to cost, complexity, etc.) then APM tends to become a kind of ‘magic’ that is hidden from developers. This ‘singleton tool’ approach effectively means we lose out on learning and reasoning about the software system, and a crucial route to improvement is lost. Instead of ‘painting on’ APM in the Production environment, we can use the techniques mentioned above – event type IDs, configurable log severity levels, and transaction tracing – to help us discover how the system really works, opening the door to ‘third-way DevOps’ feedback cycles for learning and improvement. It also means that developers and operations people use the same tool – log aggregation – to diagnose problems both in development and in Production, bringing Dev and Ops closer together. Logging done well, with a good log aggregation tool, is the ultimate DevOps technique!