One of the most common use cases for network traffic analysis is WAN link bandwidth monitoring. The challenge for most network managers is that increasing link speeds is not always the solution. Links get overloaded, for one, and you need to find out what the root cause is before you consider upgrading them.
The good news is that most network equipment will already have built-in features that allow you to find out what is happening on your network. You just need to pick the right one, to give you the level of visibility that you need.
1. SNMP polling
Simple network management protocol (SNMP) allows you to get interface statistics like port speed and utilization. You will need a SNMP polling application to query router interfaces at regular intervals. It is an efficient way of getting high-level information, but you won’t be able to drill down to find the source of problems.
2. Flow data analysis
NetFlow, sFlow and IPFIX are examples of flow standards. Flow features on routers and other layer 3 capable devices provide the ability to collect IP network traffic as it enters or exits an interface. You need a flow collector that will collect the flow records; this data can be used to generate graphs and reports on WAN link usage.
You should try to collect the flow data as near as possible to the routers/switches you are monitoring. For example, if you install your NetFlow collector at your data center, you need to collect the flow data from the routers located at the data center. Don’t collect the flow data from the routers at the remote sites, as you will end up with lots of extra traffic across the WAN links.
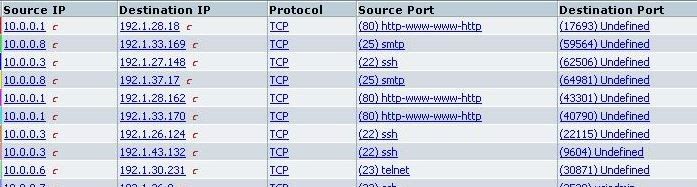
Flow data is not an ideal option if you want to monitor web traffic, and it may not be available on all network devices. However, it will allow you to drill down to see data such as IP addresses and port numbers.
3. Network packet capture
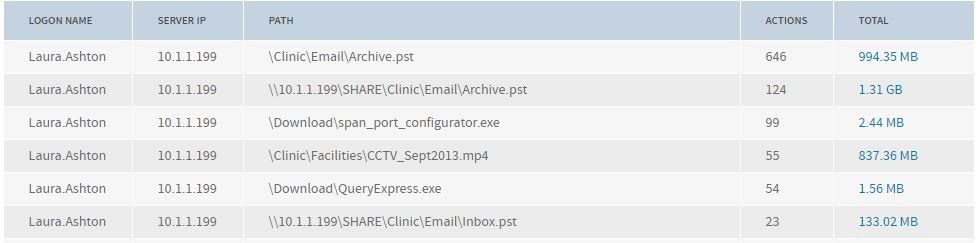
One of the richest data sources on a network is a SPAN/Mirror port or the output of a network test access point (TAP). This gives you a mirror image of the traffic moving around, and coupled with the right analysis tool, you can get visibility from layer 2 to layer 7 of the OSI model. When it comes to WAN monitoring, you just need to capture traffic going to/from router Ethernet ports.
How to filter data associated with a single WAN connection
Once you have collected your flow or packet data, you need to filter it so that you can see what traffic is associated with a specific link. While some of the flow standards support the export of interface names, most people choose to filter the data based on subnet(s).
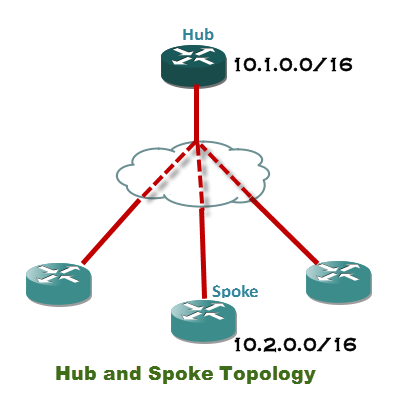
For example, let’s say we have a hub-and-spoke network topology and the data center uses network addressing 10.1.0.0/16. This is known as CIDR notation. If you are not sure which CIDR notation to use, you can calculate it by using the subnet mask of the clients and/or servers at the remote site. For example, if the clients at the remote site use a subnet mask 255.255.0.0 and the IP address of a client is 10.2.100.29, the whole network can be represented as 10.2.0.0/16.
Here is a handy CIDR calculator you can use to work out what notation you need to filter data going to and from a specific network. You can then use this within your bandwidth monitoring tool to show all traffic associated with the remote network.