
One benefit of InsightVM reporting is that it enables security teams to build accountability into remediation projects. There are a number of ways this can be accomplished and the approach you take will be dictated by your organization’s specific structure and needs.
In this blog, we’ll look at two types of console-driven reports and two types of cloud-driven reports (projects). Depending on who will be conducting remediations, you may choose one over the others. We’ll explore why in detail below.
Reporting Prerequisites
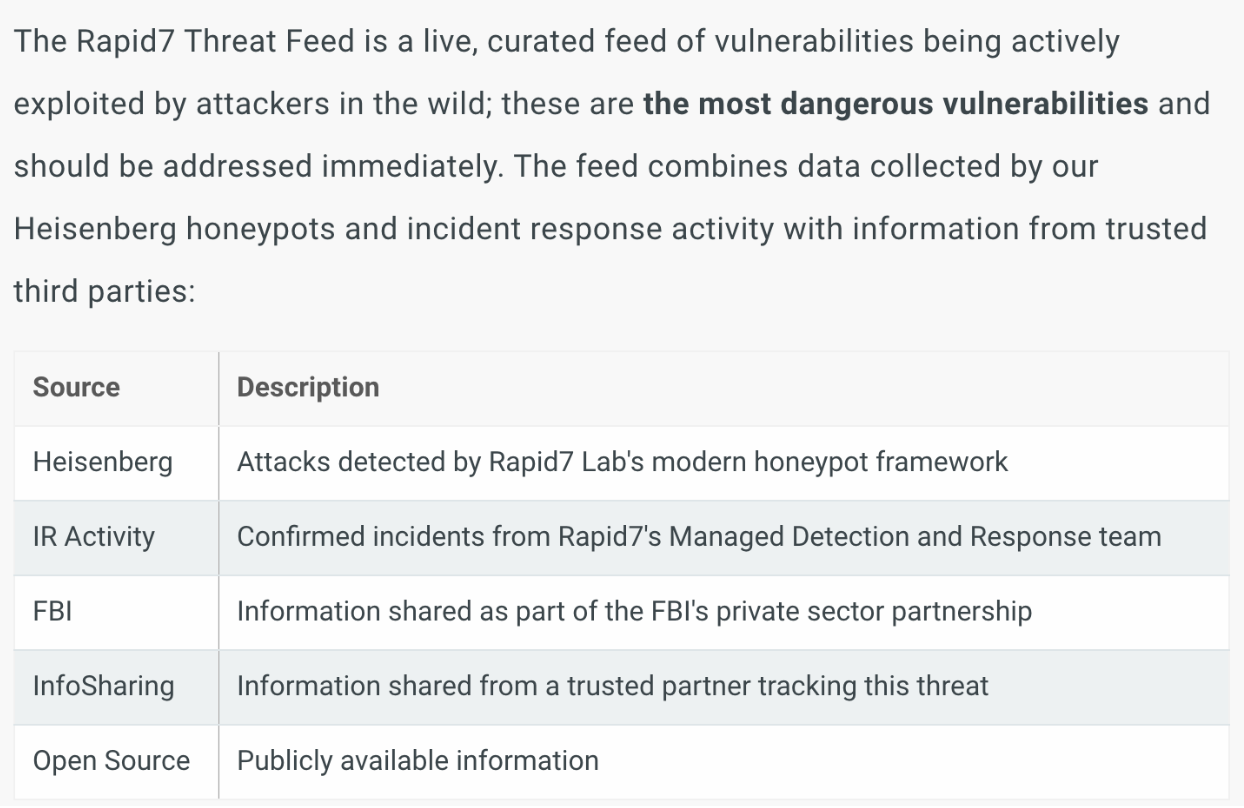
Before we can get too deep into reporting, some prerequisites need to be met. Mainly, we need scan data in the InsightVM console. To get scan data, we need to perform at least one site run against at least one asset (preferably with credentials or Scan Assistant) or at least one Insight Agent deployed. Whether agent-driven or traditionally scanned, the data will be in the form of a Site in InsightVM.
We can then organize the Site data into logical filters called Dynamic Asset Groups, or DAGs. We can create DAGs based on numerous filters; the most common filters are ‘OS’ or ‘IP address in the range of.’ Using these types of Dynamic Asset Groups allows us to create both OS and location-based organization of our scan data, which can later be used to scope both reports and query builder.
Remember: Use Sites and Agents to obtain asset and vulnerability data. Use DAGs and Tags to organize the data.Recommended Console Reports
Console reports are run from the Reporting link in the left-hand menu of the InsightVM console. There are two console reports that I recommend to customers. The first is called Top Remediation w/ details.
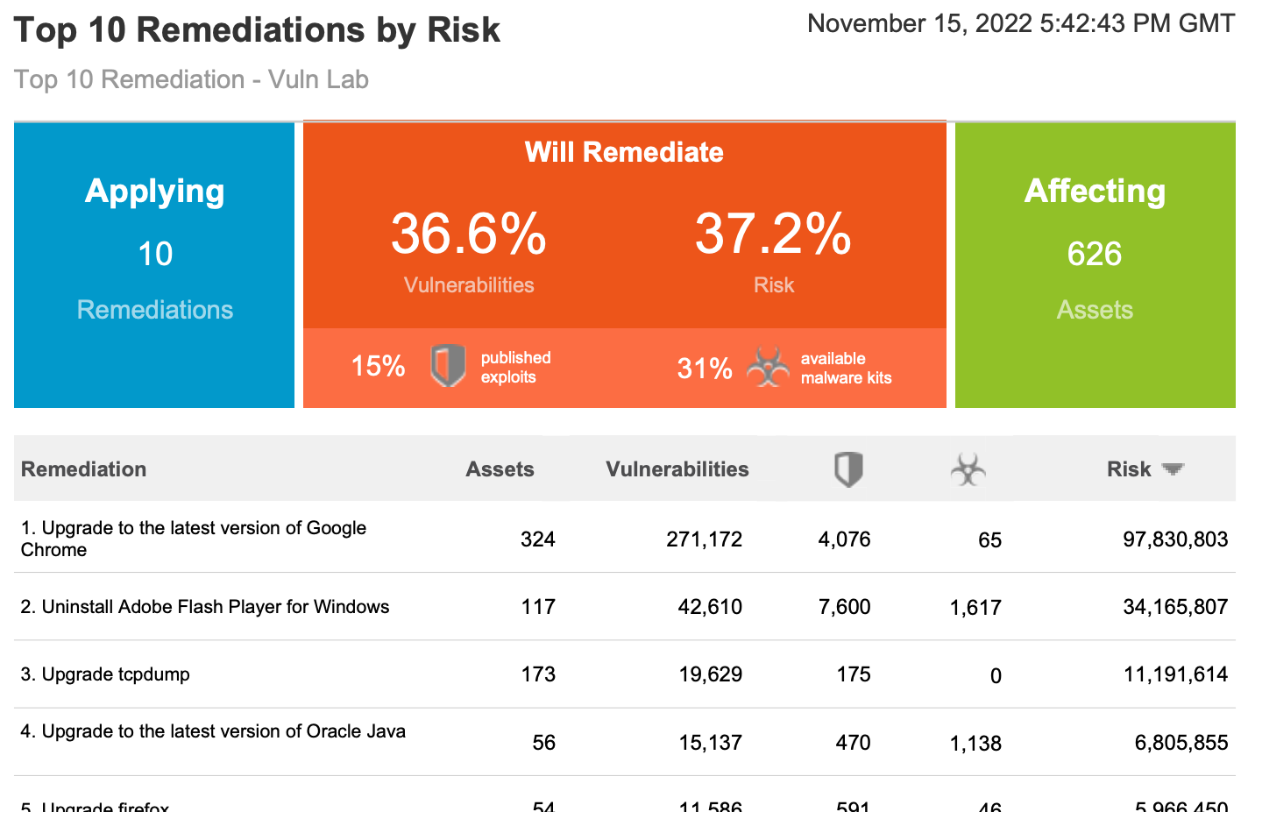
Top Remediation w/ details reports include a variety of actionable information, such as:
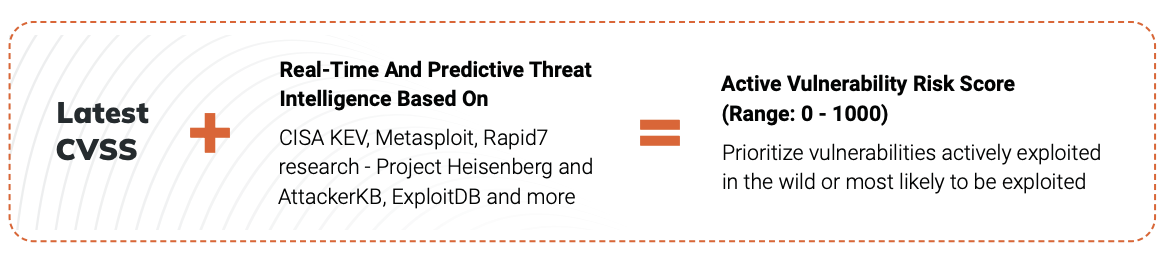
Active Risk Prioritization is Rapid7’s vulnerability risk-scoring methodology designed to help security teams prioritize vulnerabilities that are actively exploited or most likely to be exploited. Our approach takes into account the latest version of the Common Vulnerability Scoring System (CVSS) available for a vulnerability and enriches it with multiple threat intelligence feeds, including proprietary Rapid7 research, to provide security teams with a threat-aware vulnerability risk score.
The Risk score size is not the important metric, but instead, how that number compares to the other risk score numbers in the report. Prioritizing the biggest risk score first for maximum impact is a really good way to prioritize.
Solution Driven Remediation: Remediations, also known as Solutions, are the second primary reason to use this report. Solutions are usually cumulative and allow many vulnerabilities to be remediated with a single solution. The Top Remediation report only shows solutions, and when combined with risk, it enables you to see the maximum impact solutions, that will have the most significant impact on reducing risk in your environment.
Ability to change the total number of solutions: The number of solutions can be changed using the reports Advanced Options, so the report is not so intimidating. 25 Solutions is very intimidating/overwhelming, but 5 or 10 solutions are much more consumable by the remediation team.
Details show the Solution and the Assets affected: Details, being the last attribute, allows you to see the solutions for each of the Top Remediations and the assets affected.
The second console-driven report type I like to call out is called a SQL Query Export report. These reports allow customers to use the SQL Query data model to create custom CSV reports that meet their needs. Rapid7 maintains a repository of over 100 example queries on Github.
Both of these reports are highly impactful, however, there is one fundamental question I always ask before recommending them:
Is the security team performing the remediation, or will the reports be sent to another team?
If the security team is responsible for remediation, these console-driven reports are amazing because of self-accountability. However, if reports are going to another team, then one of the cloud-driven reports, aka Remediation Projects, are a better fit. Why? Remediation Projects provide the built-in accountability necessary to make progress. The key word is: Accountability
Accountability is the number one reason I recommend using Remediation Projects over the Top Remediation or SQL Query Export reports. If you generate a Top Remediation report and send it over to say, Bob, Bob may say ‘thanks’, walk around the corner, and throw it in the trash. A month goes by, and you ask, ‘so Bob, how are things going? I’m not seeing much progress’, to which Bob might answer, “prove it”.
If this sounds familiar, that’s because I hear it from many customers I work with that send reports to other teams. With PDF-based, it can be very hard to “prove it”—and then nothing ever gets done.
This is where remediation projects come in. With Remediation Projects, you can track whenever a solution is resolved, and the number cannot be manually manipulated. This means the only way to increase the ‘solutions resolved’ number is to actually fix the vulnerabilities and validate them with either a scan or an agent assessment. Now when Bob responds with ‘prove it’ you can simply reply with ‘sure, let's loop in your manager’.
I know this sounds harsh, but it's a reality many security practitioners have to work with daily.
Built-in accountability makes remediation projects the number one choice for businesses that send reports to other teams for remediation.
So, how do you create the best possible Remediaiton Projects? I usually recommend creating projects by using Dashboards. My personal favorite Dashboard is the Threat Feed Dashboard. This Dashboard can be found by clicking on “See more in the R7 Library”
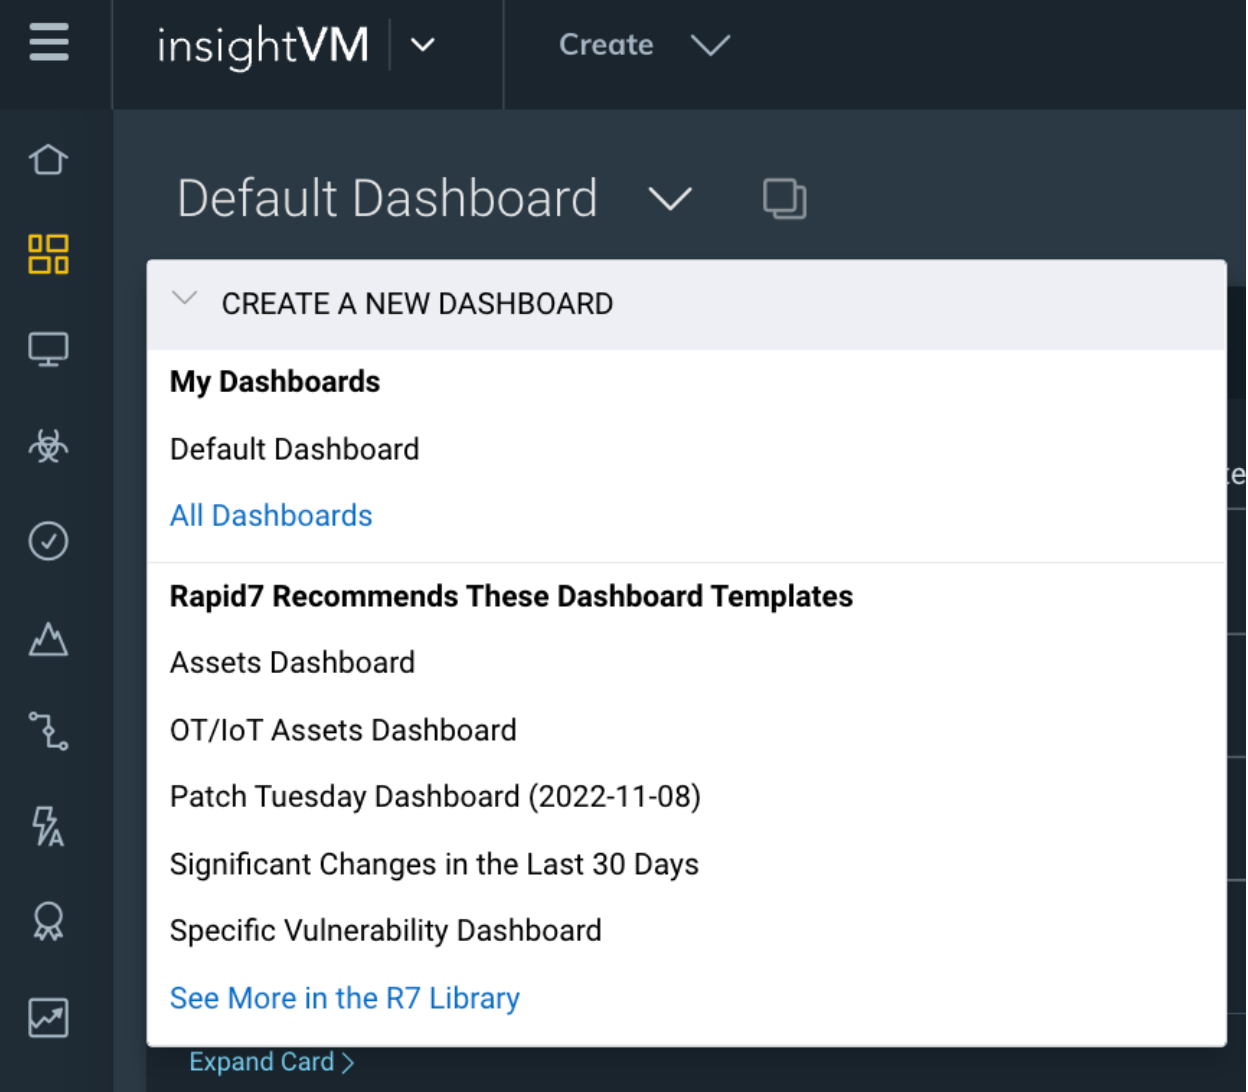
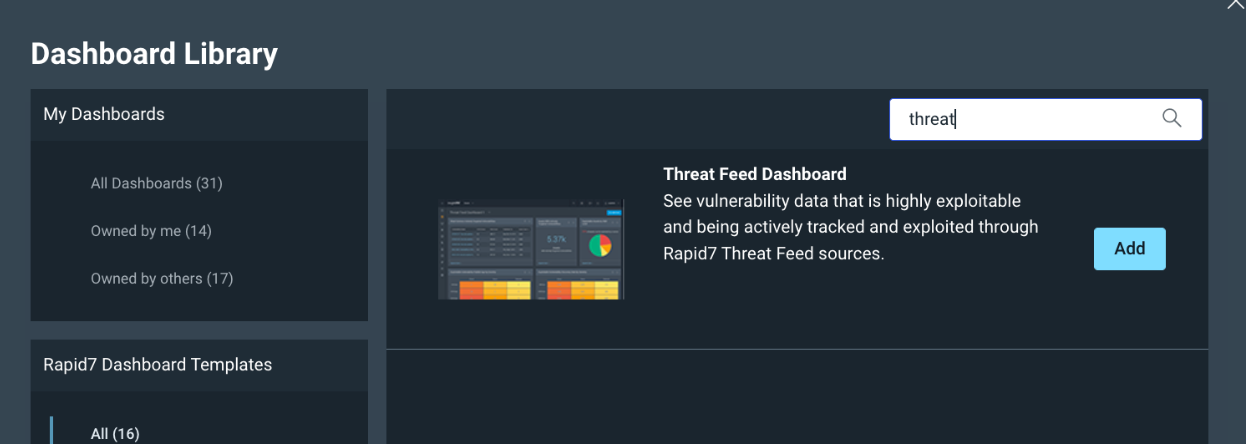
Then search for Threat, and Add the ‘Threat Feed Dashboard’.
Once this Dashboard comes up, there are three cards that I like to focus on:
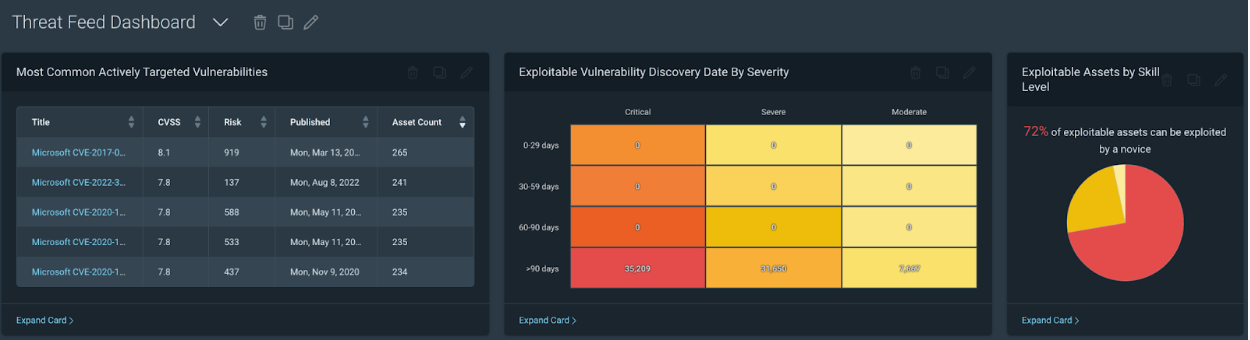
First, let’s talk about the ‘Most Common Actively Targeted Vulnerabilities card. This card is driven by Project Lorelei, which has deployed over 150 honeypots worldwide across five continents.
Prioritization utilizes CVSS, or the Common Vulnerability Scoring System. We also have Real Risk, which enhances CVSS prioritization using additional metrics (exploits, malware, publish age). Lastly, Threat feed, in my opinion, is the next level of Prioritization and should be prioritized highly within your vulnerability remediation program.
How to use Dashboard Cards to create team-based or location-based (scoped) Remediation Projects
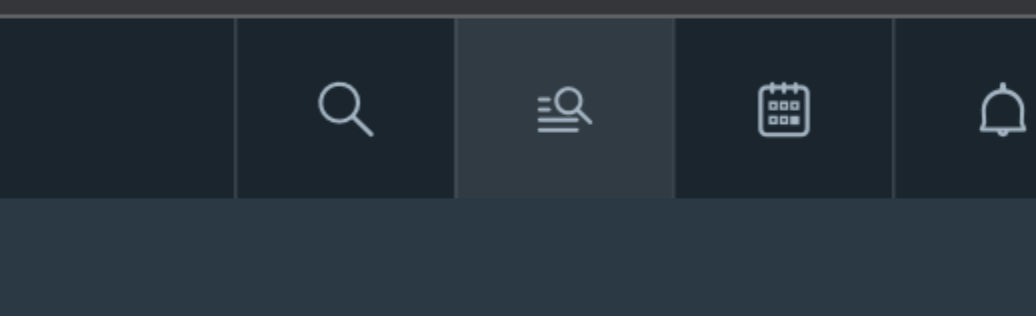
Before we dive any further into the Most Common Actively Targeted Vulnerabilities card, I first recommend clicking on the Query Builder. The query builder link can be found in the upper right of the page:
Query Builder is a way to see all of your data, and create filters for that data and save those filters in the form of queries. If you have been following along, then we should already have some DAGs created within the console for data organization. We can use one of those DAG’s to create a filter in Query Builder. For example we can Add a filter for “asset.groups IN” and select one of your asset groups, in my example, I am using Windows Devices:
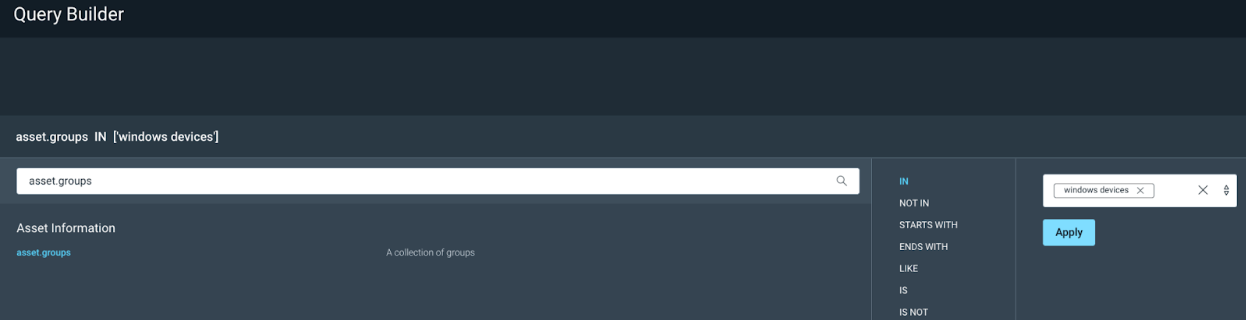
On my test console, this filters only Windows devices, and I can now Save that query so I can use it to scope my Dashboards and Projects based on the Windows Team.
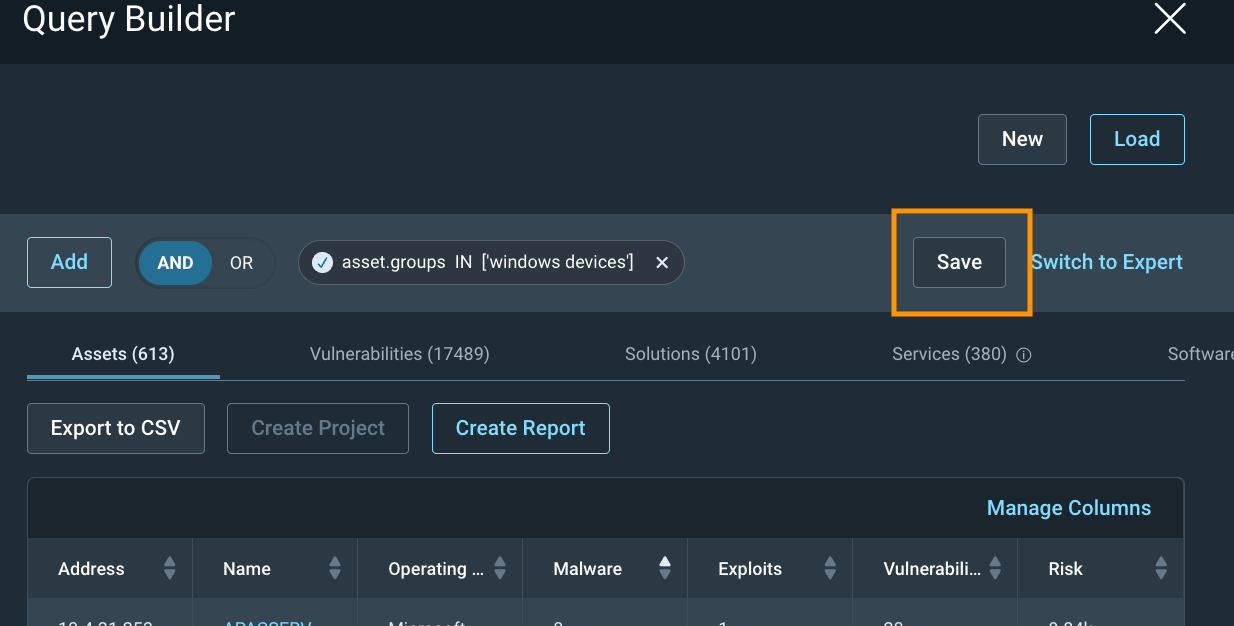
Once it is saved, hit the X in the upper right corner to exit out of Query Builder.
Now that we have a Saved Query, we can Load that query into our Threat Feed Dashboard by clicking on ‘Load Dashboard Query’:
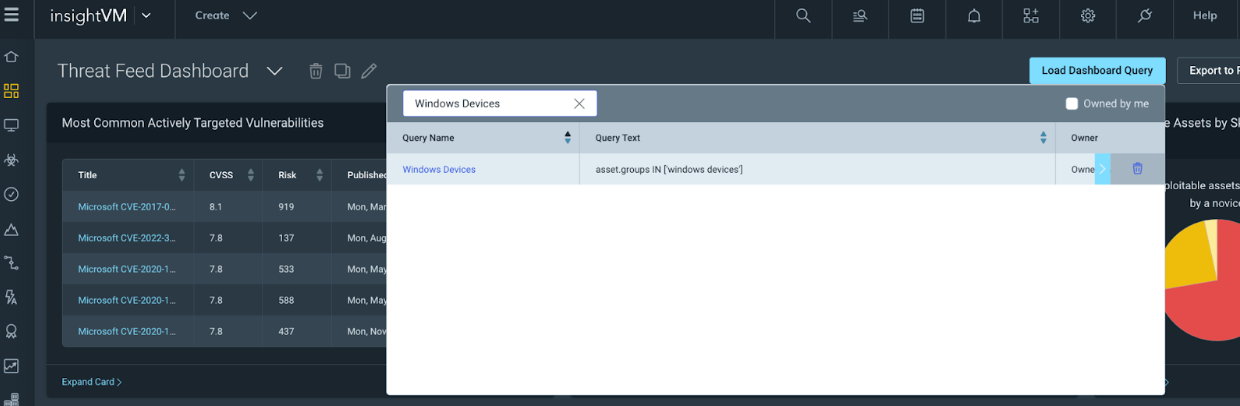
Once the query is loaded, our Threat Feed Dashboard will now only show assets defined by the Windows Devices query, which is scoped by the Windows Devices DAG within the Console.
This can be helpful if you want to create a custom team-based Dashboard for each team.
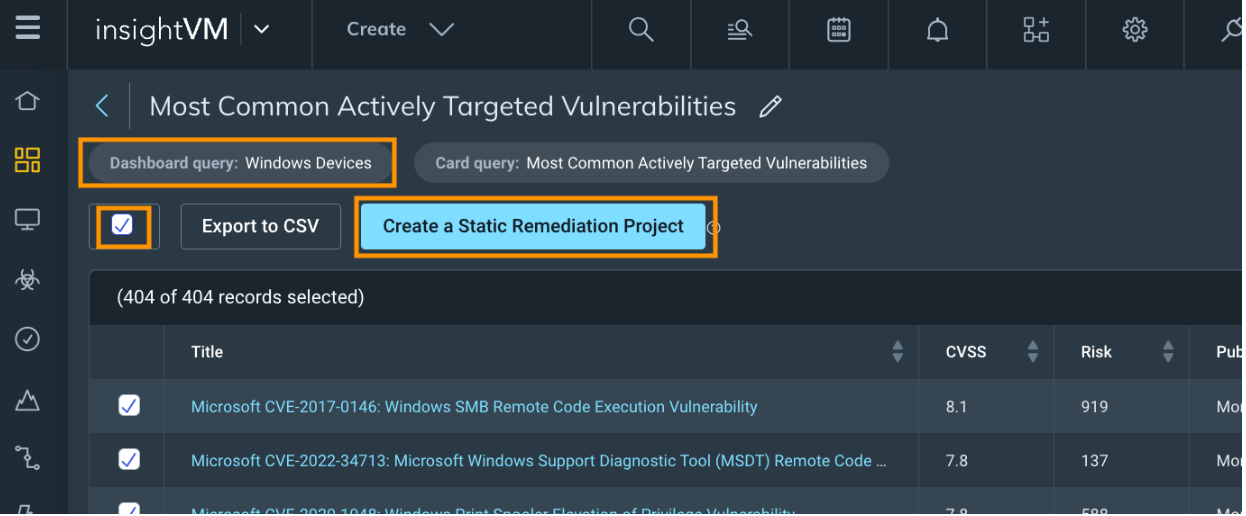
Next, if we click on the ‘<Expand Card>’ option within the Most Common Actively Targeted Vulnerability card we can see that the card is also scoped with our Dashboard query. We can then select All of the solutions (Or just the top 10 sorted by risk) and click on ‘Create a Static Remediation Project’ to use the scoped threat feed dashboard card to create a static project. For more information on reating a remediation project, click here.
Lastly, I like to focus on the following two cards with or without a query loaded into the Dashboard:
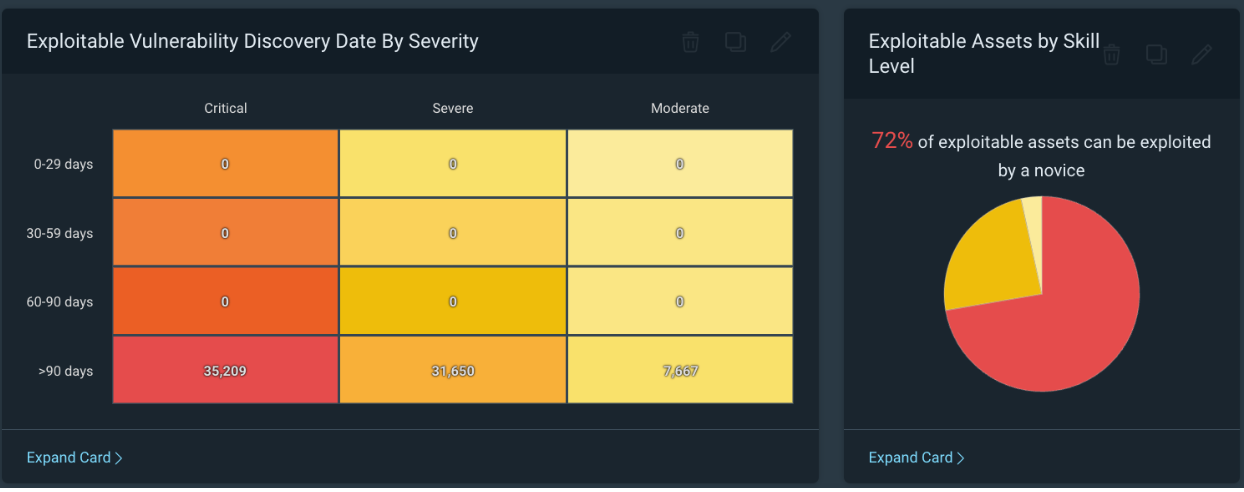
The above screenshot is lab data by the way, hopefully this doesn't look familiar. The Most Common Actively Targeted card is amazing and should be prioritized, but I also really like this card as it focuses on Exploitable vulnerabilities by Severity.
Based on the card labeled ‘Exploitable Assets by Skill Level’, we can see in my test environment that 72% of exploitable assets can be exploited by a novice. This should be a very scary number, and we should prioritize reducing this number as quickly as we can.
If we look at the ‘Exploitable Vulnerability Discovery Date by Severity’ card, we can see how long we have known about exploitable vulnerabilities in our environment. The Discovery date is the same as the find date in our own personal environments. Based on the example above, we have over 35,000 critical exploitable vulnerabilities that we have known about for over 90 days and have not fixed. This environment is all test data, but if your environment looks similar this should be a very scary thing to be seeing.
For example, as security practitioners, we should ask the fundamental question, ‘What if I get breached?’. One answer might be to determine the vulnerability that caused the breach. Another might be, how long have we known about the vulnerability and not fixed it? If the answer to that second statement is less than 60 days, hopefully, you can already start thinking about the many excuses we could use; however, if it's over 90 days, the excuses start to get pretty difficult to come up with.
To prevent not only a breach but also to prevent being in a situation where you need to explain why the breach happened on a vulnerability that has been known about for over 90 days, I highly recommend using this card as a source of data for additional Remediation Projects.
Conclusion
To summarize our journey: We created some sites to bring in vulnerability data into our console. We then organized that data using Dynamic Asset Groups (DAGs). We then used those DAGs to scope query’s (in Query Builder) so we could scope Dashboards. With the scoped dashboard, we get scoped cards which we used to create Projects.
With the Query Builder we get organization. Combining the query with the Threat Feed Dashboard, we get Organized Prioritization. If we then use this data to create Projects we get Organized Prioritization with Accountability. This is a perfect combo to get some work done in reducing vulnerabilities using Reporting.
Remember that the number one reason to use projects is Accountability.
To learn more about InsightVM remediation capabilities, check out the following blog posts:
InsightVM Release Update: Let’s Focus on Remediation for Just a Minute
Decentralize Remediation Efforts to Gain More Efficiency with InsightVM