We build Nexpose to help security practitioners get from find to fix faster. With the launch of Nexpose Now, Rapid7 delivered Liveboards to help you know what's weak in your world right now. Liveboards combine your live threat exposure data, powerful analytics and intuitive querying so you can spend less time compiling data, and more time improving your security program. Liveboards, powered by the Rapid7 Insight Platform, continuously deliver improvements from our engineers to your fingertips and without maintenance effort on your part.
We know its hard to keep up with change; so we'll be sharing tips, tricks and new capabilities in right-sized blog posts. In this post, you'll learn one way Liveboards can do heavy lifting for you: customizing and tailoring your dashboards to match your world.
Time for some action
Nexpose Now Liveboards provide visibility into what is weak and the power to dive into your data, enabling you to take action. Dozens of built-for-purpose Cards are available in Liveboards with more being released on a regular basis. Cards help you focus on what matters in an easy to understand and easy to act on form. Spending less time in Excel pivot tables means more time on the actual work of driving remediation.
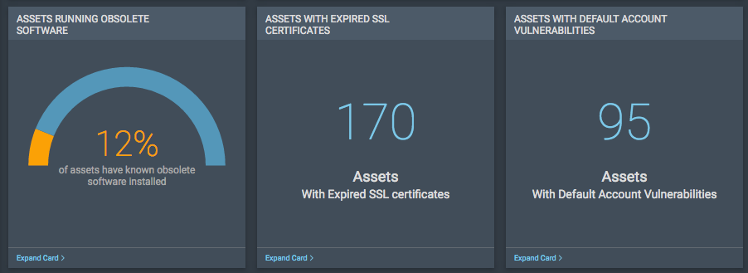
Consider the three Cards above. Driving Assets with Expired SSL Certificates to zero is a worthy goal, as is minimizing Assets Running Obsolete Software. But, these metrics may require refinement before taking action in your organization. If your remediation teams work on a site-by-site basis, understanding the percentage of assets running obsolete operating systems is interesting but not sufficient to drive remediation. When you're trying to get to fix faster, getting to action in your remediation teams is critical. We could help our cause by breaking down our data into parcels the remediation teams understand.
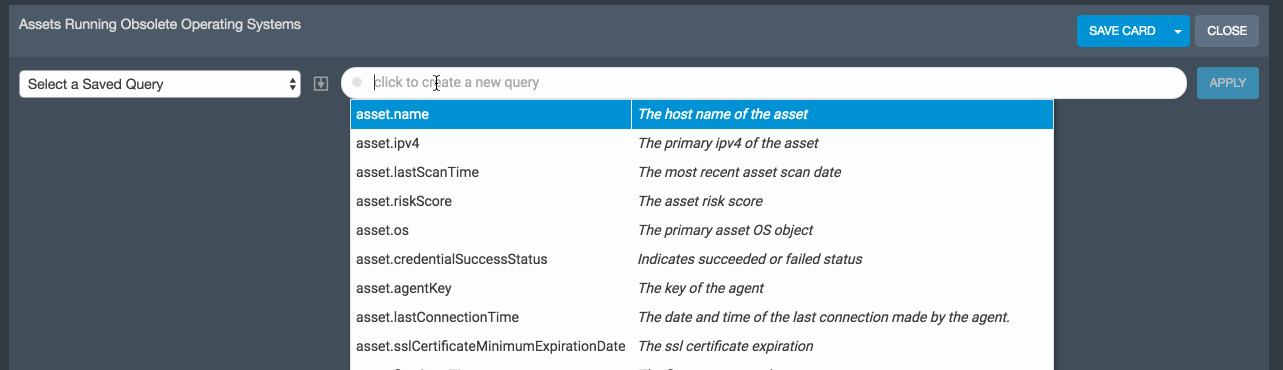
Dig a bit deeper by clicking on the Expand Card link and we're immersed in Asset data. Some remediation teams have ownership of Assets of a specific operating system type. An easy way to start is by narrowing down by OS family.
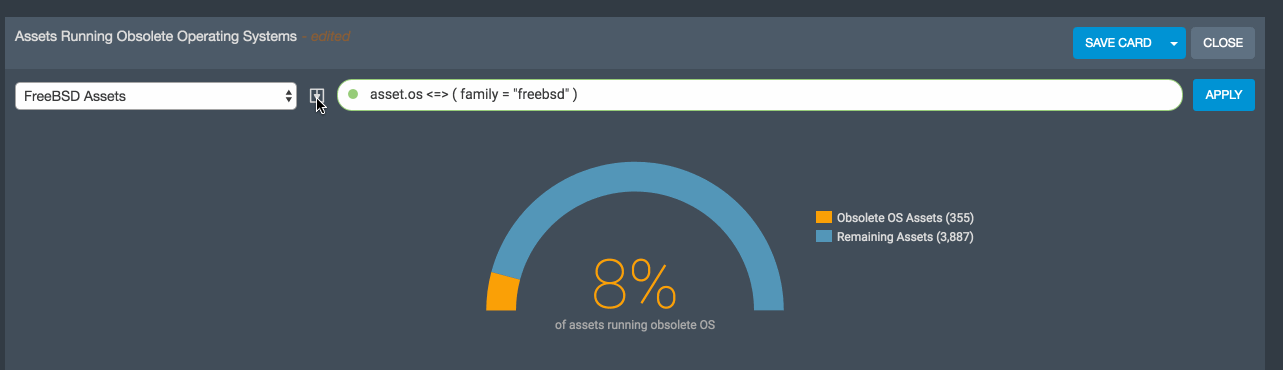
That query looks useful! Since you've spent time crafting it, maybe you want to save it and use it again later? Here I show how to save a query called "FreeBSD Assets" and then create a copy of the Assets Running Obsolete OS Card but only for FreeBSD Assets.
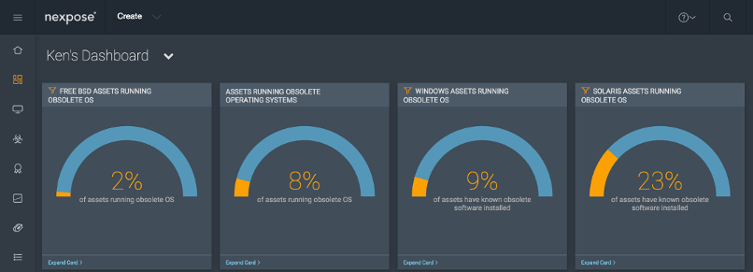
Repeat this process for each of the OS's supported in your organization and you arrive at a powerful comparison. Here we see percentages of Assets running obsolete operating systems by OS family. With this view, you can quickly see differences and get a much better sense of what is weak: perhaps the Solaris systems need some attention.
Do you want more?
Give this technique a try with your own data. I used a simple example of filtering by OS, but you can easily build refined queries and Cards to make Nexpose work for you. Some other ideas you could try:
- Compare KPI on new assets discovered across Sites or Asset Groups
- Create individual Dashboards for individual teams or Sites
Let us know if you find useful ways to compare and share them here.